There’s something fascinating about looking at ancient ruins and imagining what the lives and culture might have been like of the people who lived there. With the everchanging advancements in technology, researchers can get closer than they ever have to solving these mysteries.
Ball State University faculty John Fillwalk, senior director of the Institute for Digital Intermedia Arts (IDIA Lab) and associate professor of electronic art, is merging cutting-edge digital technology with archaeological research. His latest project involves bringing Pumapunku, an ancient temple in the pre-Incan city of Tiwanaku, to life through digital modeling, offering new perspectives on one of the world’s most mysterious archaeological sites. His work was highlighted in a recent episode of Ancient Aliens, produced by the History Channel.
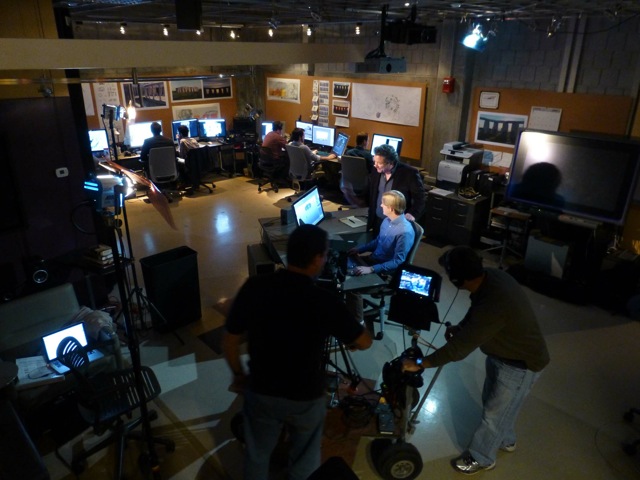
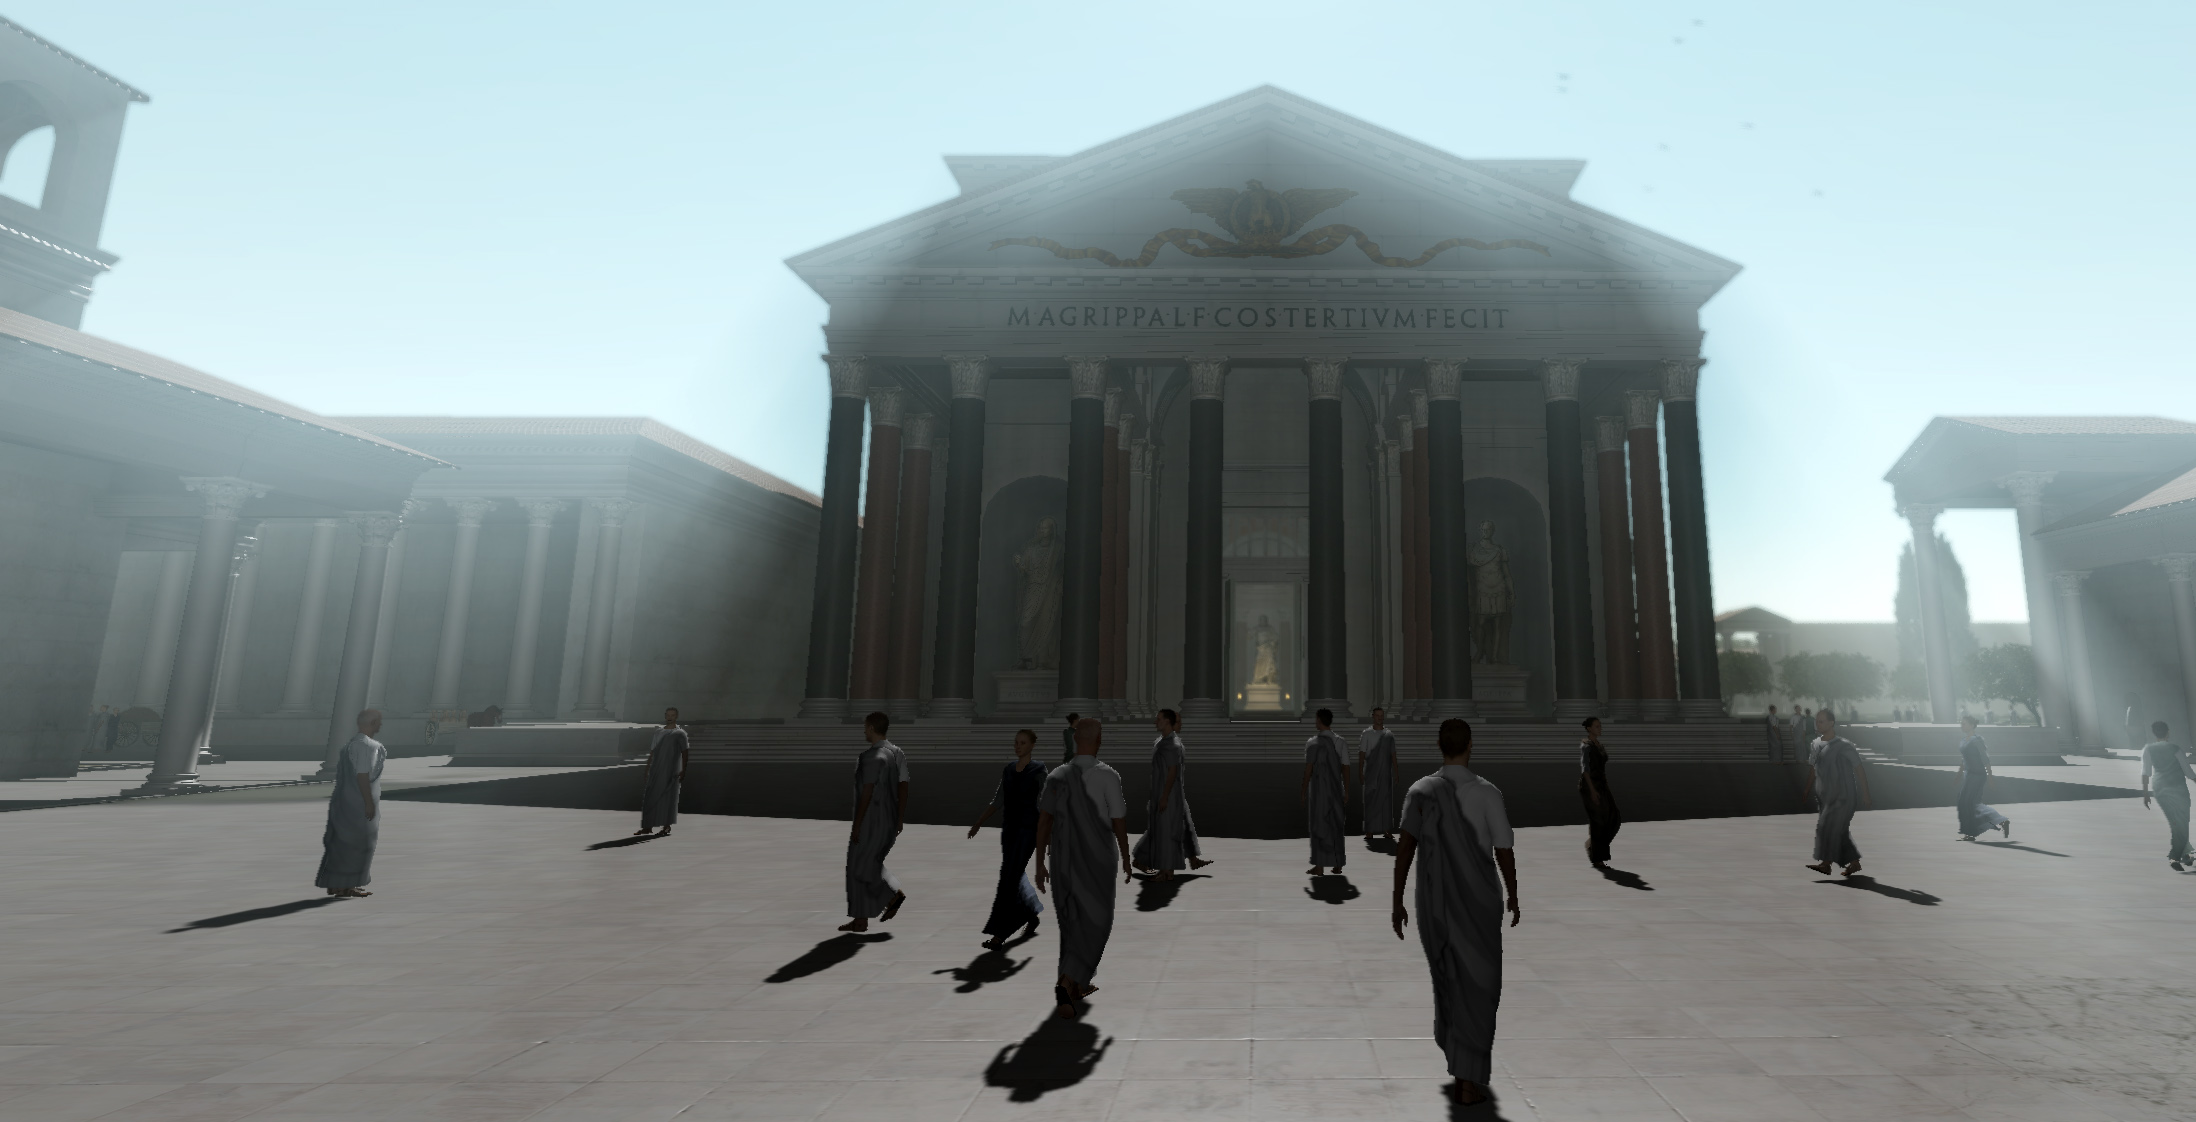
“Ball State’s IDIA Lab was featured on a couple of episodes with History Channel for the Universe series—one on Ancient Rome and another on Stonehenge,” Prof. Fillwalk said. “In both of those projects, we employed 3D technology in various ways to simulate archeological sites that are mostly in ruin and bring them back to life virtually.
“Over the years, we have developed some niche expertise in working with archeologists to examine these ancient monuments. We deploy NASA’s JPL data to create an accurate virtual Sun and Moon based on a specific location and time period. And because we had worked with History Channel previously using those techniques, they approached us with this new project.”
Pumapunku: A Historical Marvel
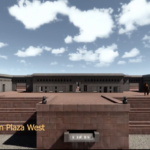
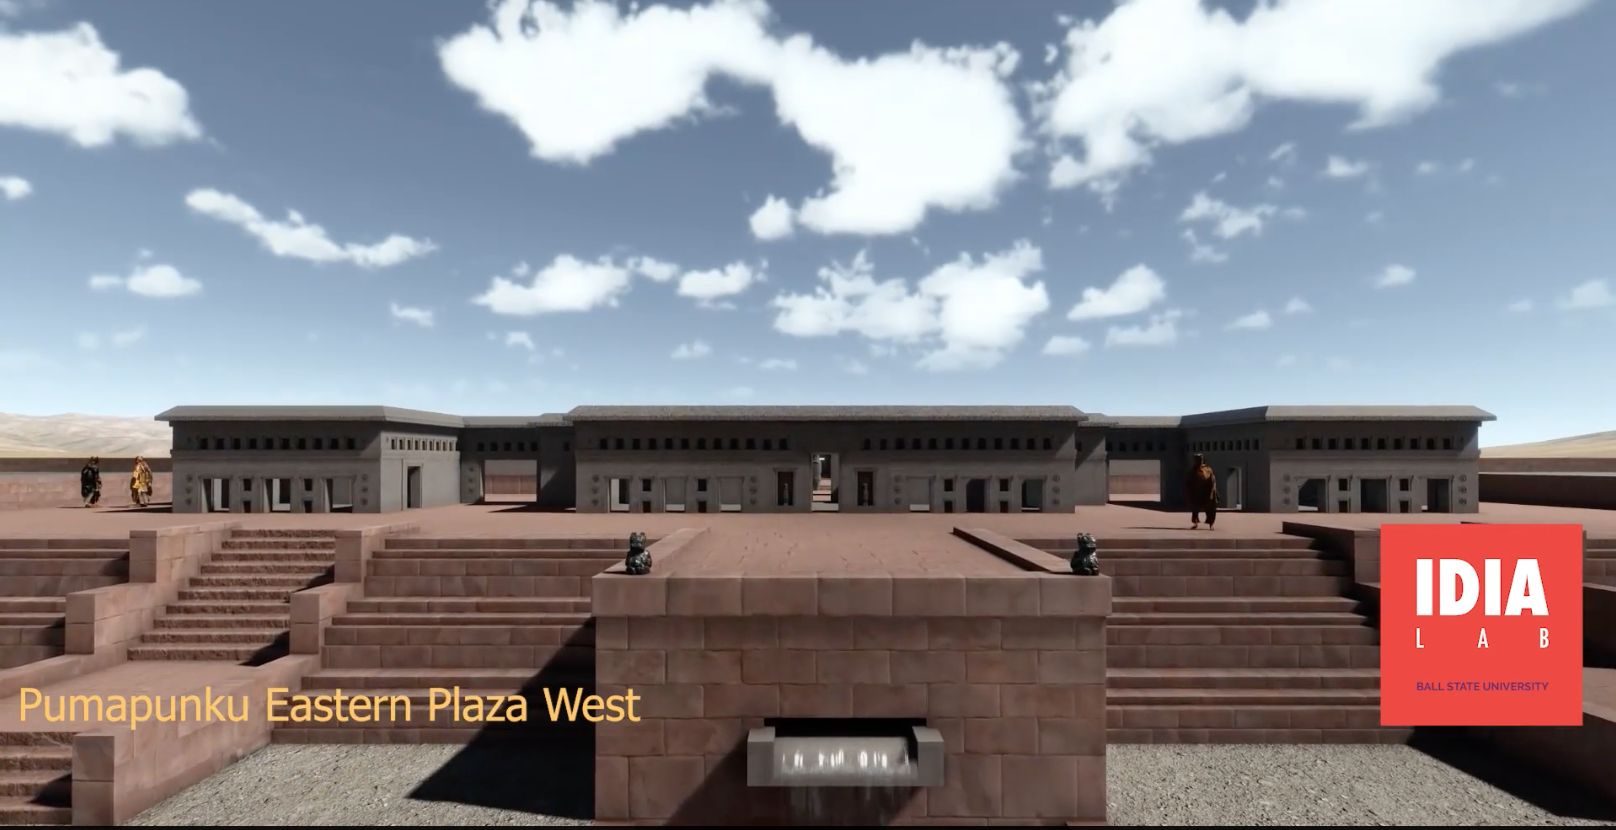
IDIA Lab digial 3D model of Pumapunku
Experts disagree on the age of Pumapunku. The site is part of the larger Tiwanaku complex and is believed to date back over 1,500 years to A.D. 500. It has puzzled historians and archaeologists because of its advanced engineering and intricate stonework.
Pumapunku, often called the “Gate of the Puma,” is located in the Bolivian highlands near Lake Titicaca and was part of the Tiwanaku civilization, which predates the Inca Empire. The city’s stone blocks, which weigh several tons each—the largest clocks in at 144 tons—feature precise cuts, perfectly straight edges, and intricate geometric patterns that defy the technological capabilities typically attributed to ancient civilizations. Some scholars have speculated that Pumapunku’s architects possessed advanced knowledge of astronomy, mathematics, and engineering.
The mystery of how the ancient Tiwanaku people managed to transport and carve such large stones has captivated researchers for decades. Traditional theories suggest the use of rudimentary tools and methods like wooden rollers or ropes. However, no definitive explanation has been found, leaving plenty of room for modern-day investigation.
IDIA Lab’s Digital Approach
Prof. Fillwalk and his team at IDIA Lab worked for several months to digitally reconstruct Pumapunku using advanced 3D modeling and simulation techniques. This project is not merely a visual recreation but an attempt to understand the cultural, architectural, and environmental context of the ancient city. By doing so, his team hopes to provide deeper insights into the construction methods used by the Tiwanaku civilization and the site’s possible significance in pre-Columbian history.
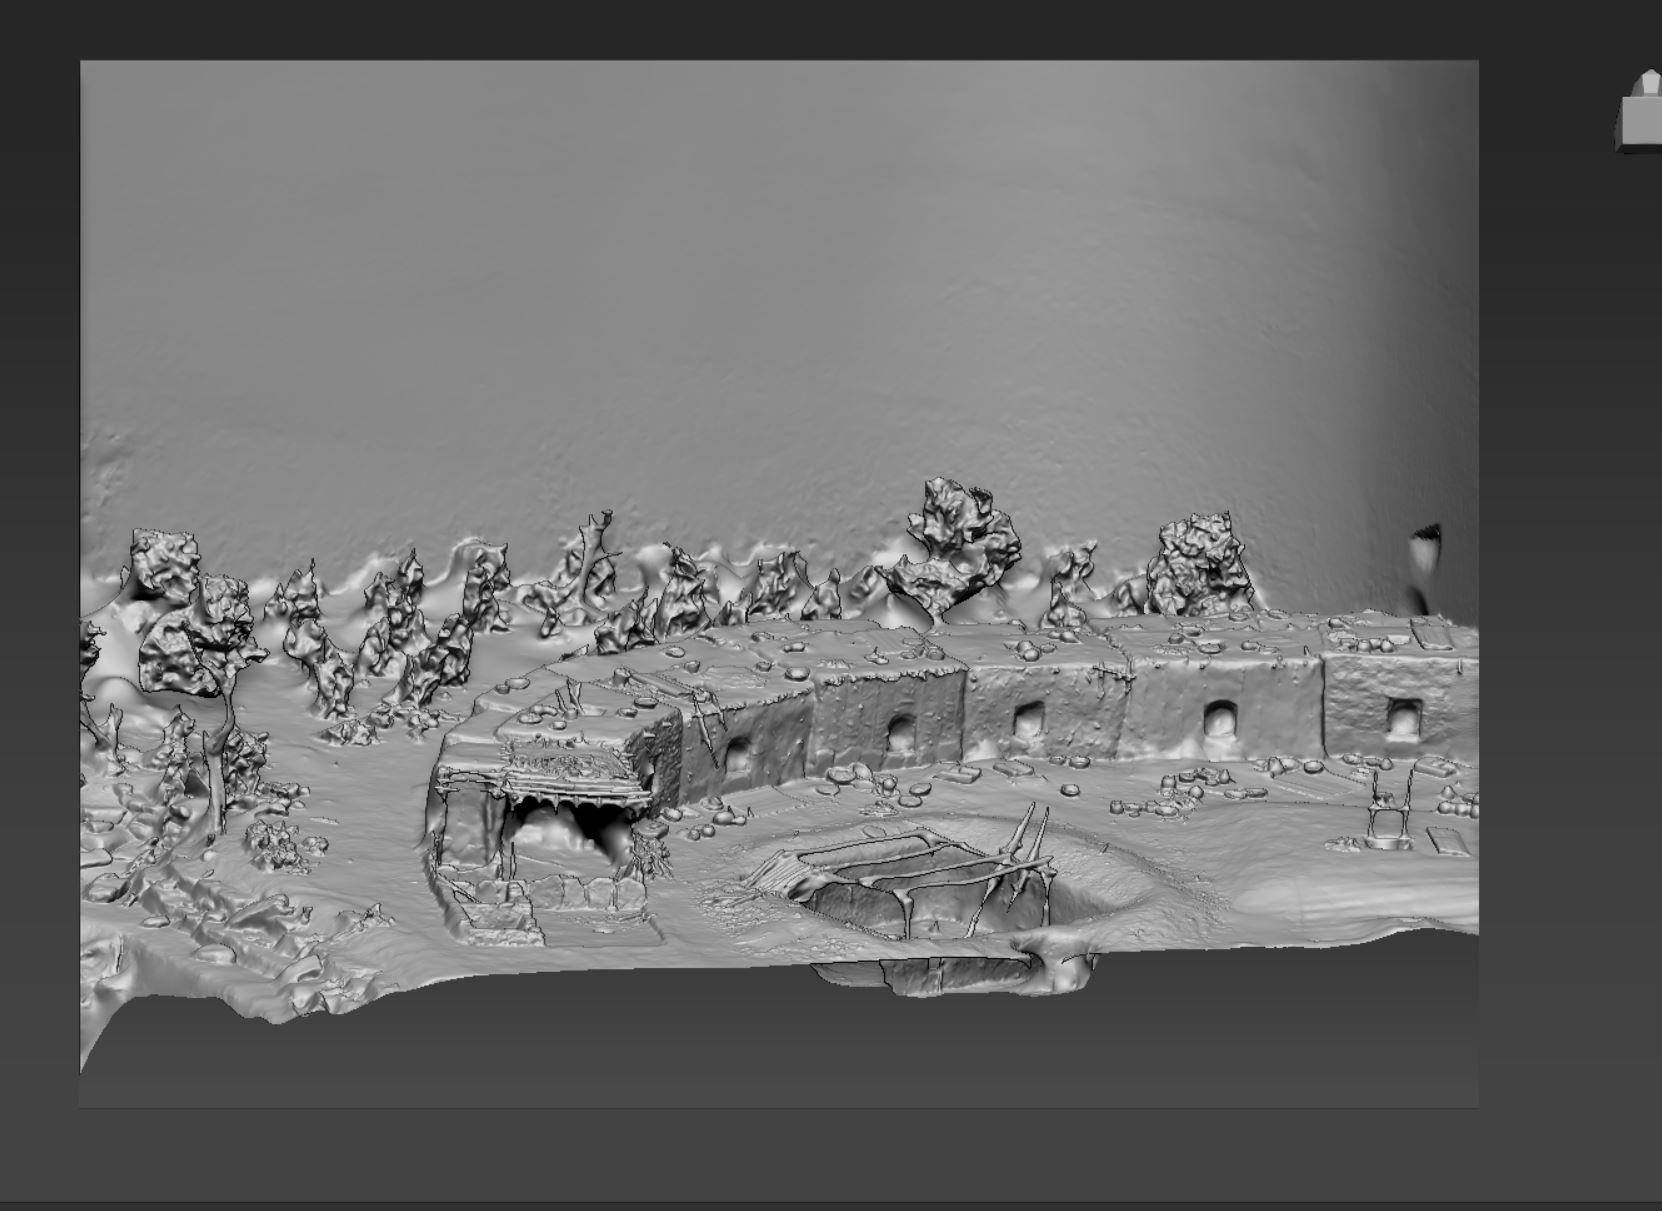
To create the digital model, Mr. Fillwalk and his team used photogrammetry—a technique that uses overlapping photos to create models, laser scanning, measured hand modeling, and other 3D imaging techniques to capture the exact dimensions of the stone structures at Pumapunku. These data sets are then used to build a highly detailed, accurate, three-dimensional representation of the site. But since the location is in ruin and was never even finished before being abandoned, Mr. Fillwalk and other researchers have had to do their best to fill in gaps and imagine what the final product might have been like.
“The city really is a mess,” Mr. Fillwalk said. “It’s probably one of the most challenging sites we’ve ever tried to reconstruct because, first of all, the architect itself was incomplete— abandoned before totally constructed. We’ve tried to imagine the original architects’ vision. The other problem is that various parties have looted it over the years, looking for gold and such. In one instance, they used dynamite to excavate and just blew up a large section of the foundation. Many stones were taken away or relocated, ending up in local churches and houses.”
Despite these challenges, Mr. Fillwalk is pleased with the results and confident with the final product. Since finishing the episode with the History Channel team, he has collaborated and completed even more work with Dr. Alexei Vranich, archeologist and the leading expert on Tiwanaku and a professor at the University of Warsaw, Poland.
“Sometimes when I work on projects like this, I get a bug about it, so I really wanted to go further with the project,” FIllwalk said. “What we did for the show was a cursory interpretation, but we’ve taken it further since, using Dr. Vranich’s data from his excavations. We are pretty confident in our interpretation. I think it’s as good as we can do at the moment, given the data we have access to.”
Director Fillwalk’s Pumapunku project demonstrates how technology can revolutionize the study of cultural heritage and ancient civilizations. By integrating archaeological expertise with state-of-the-art digital tools, Mr. Fillwalk and the IDIA Lab, centered within the Estopinal College of Architecture (ECAP), are unraveling the mysteries of Pumapunku while making the ancient site accessible to a broader audience than ever before. Their work bridges the gap between the past and the future, providing new perspectives on one of the most enduring architectural mysteries.
“Resurrecting Puma Punku” (Ancient Aliens S20, E20) aired on Sept. 14, is available on some streaming services and will be rebroadcast on the History Channel.
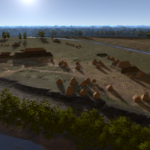
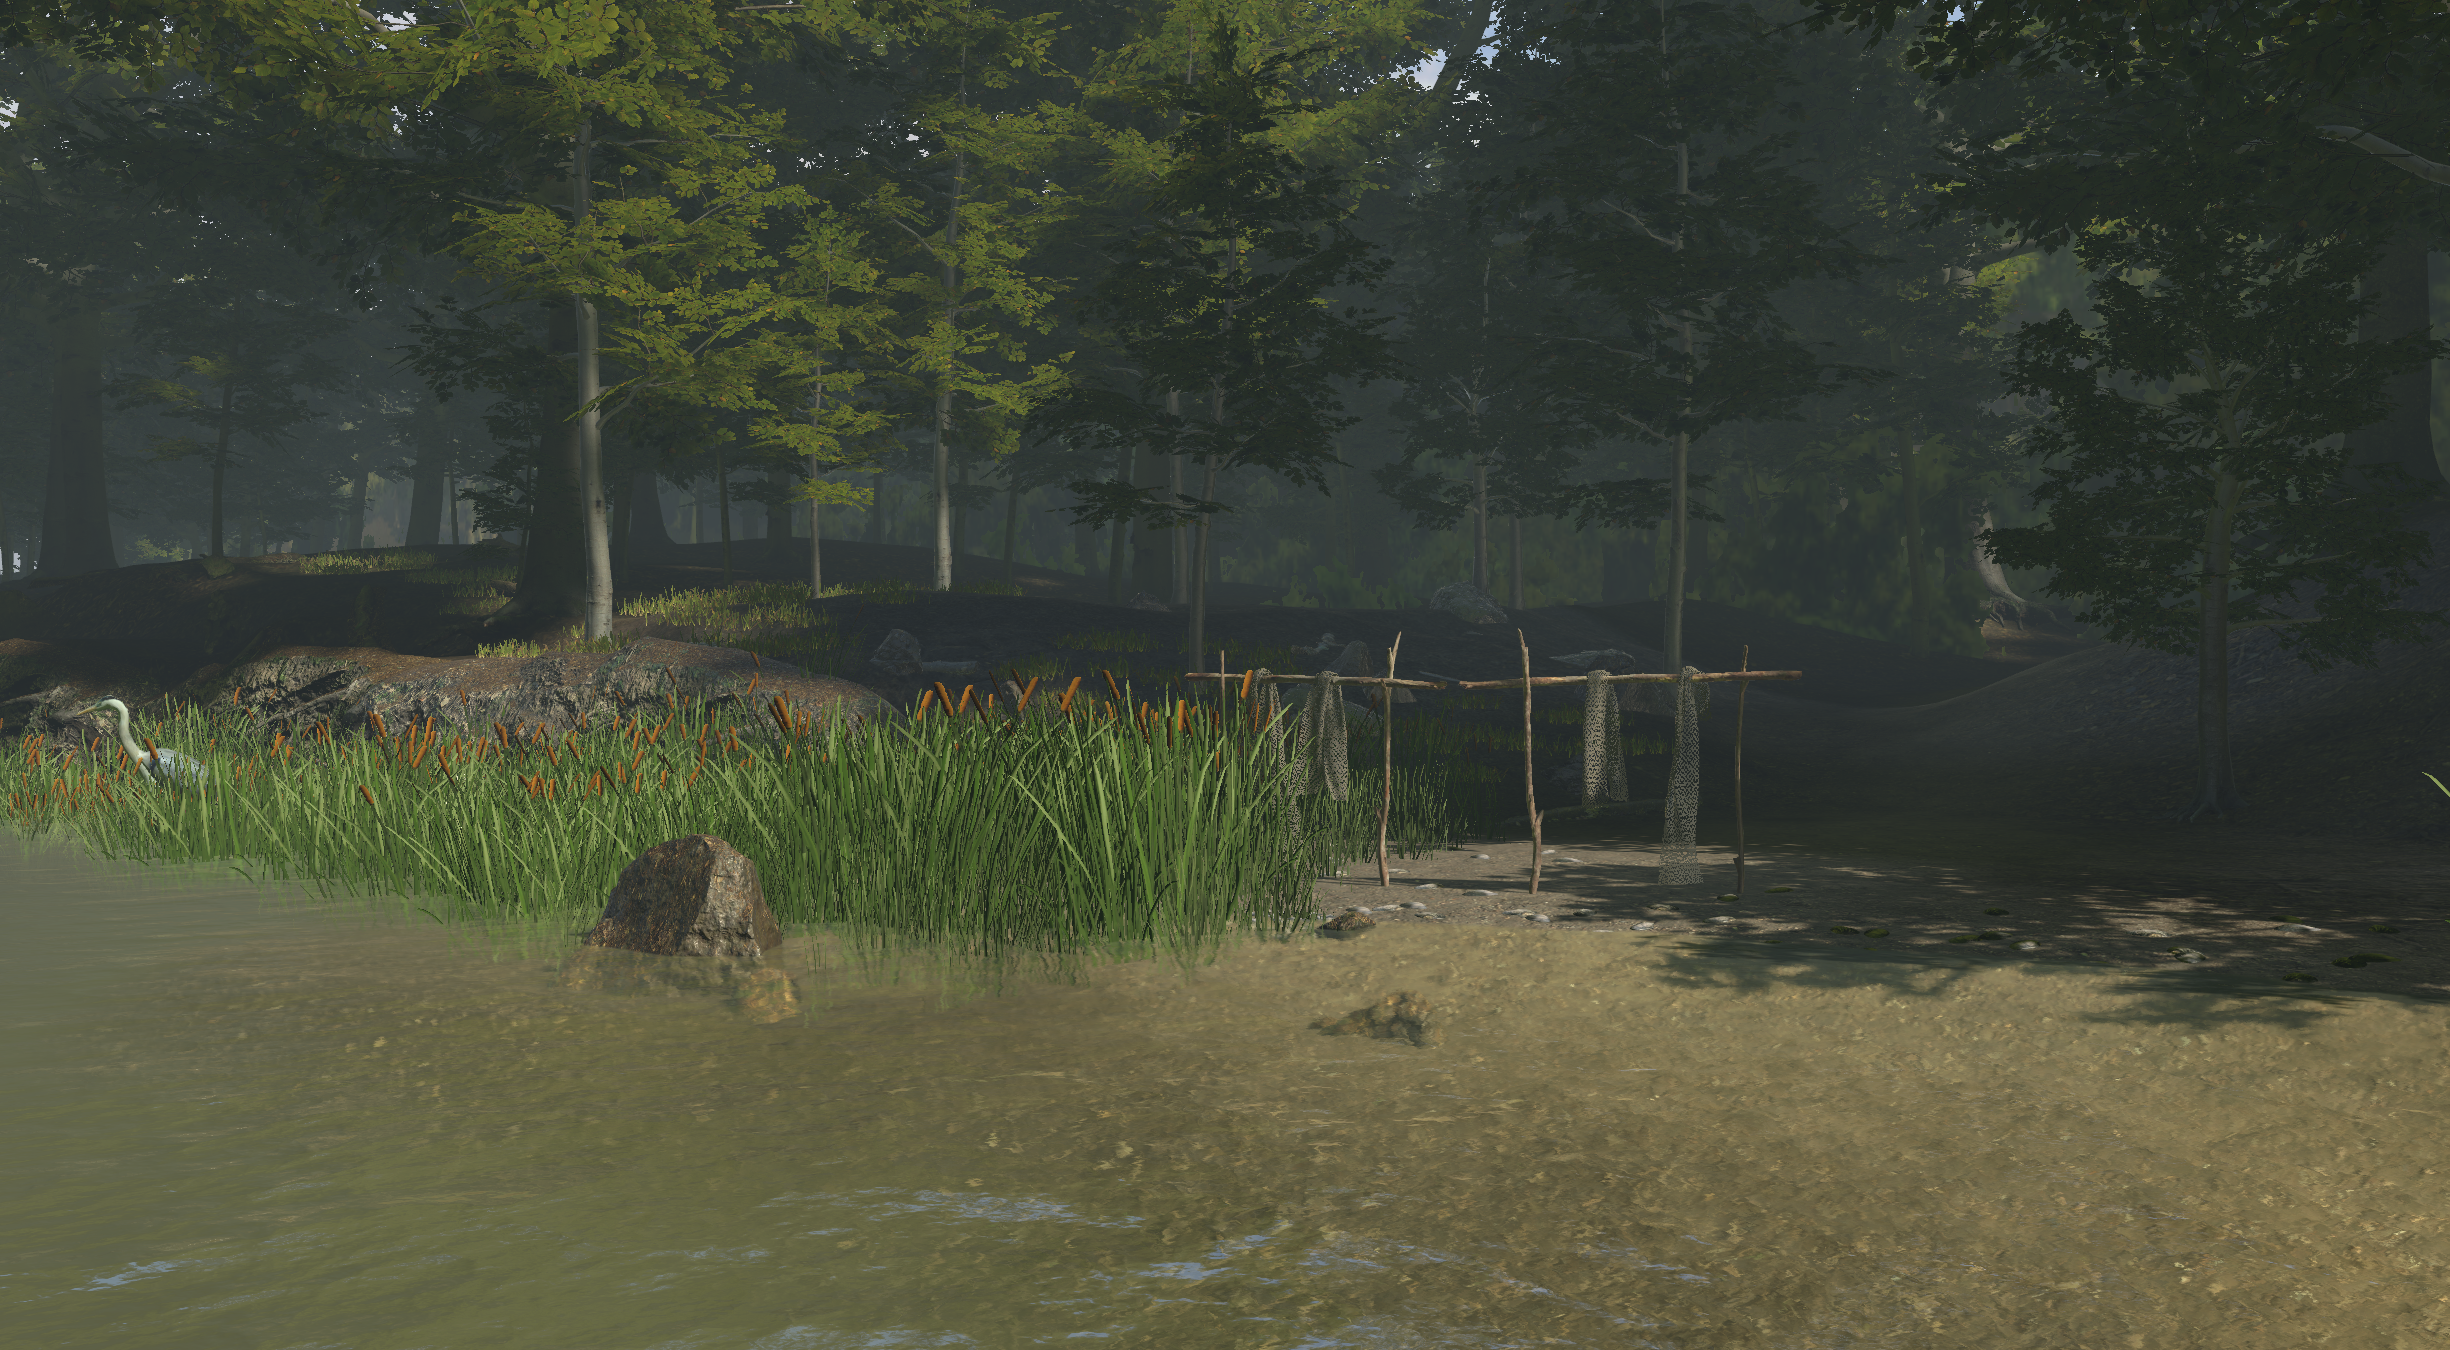
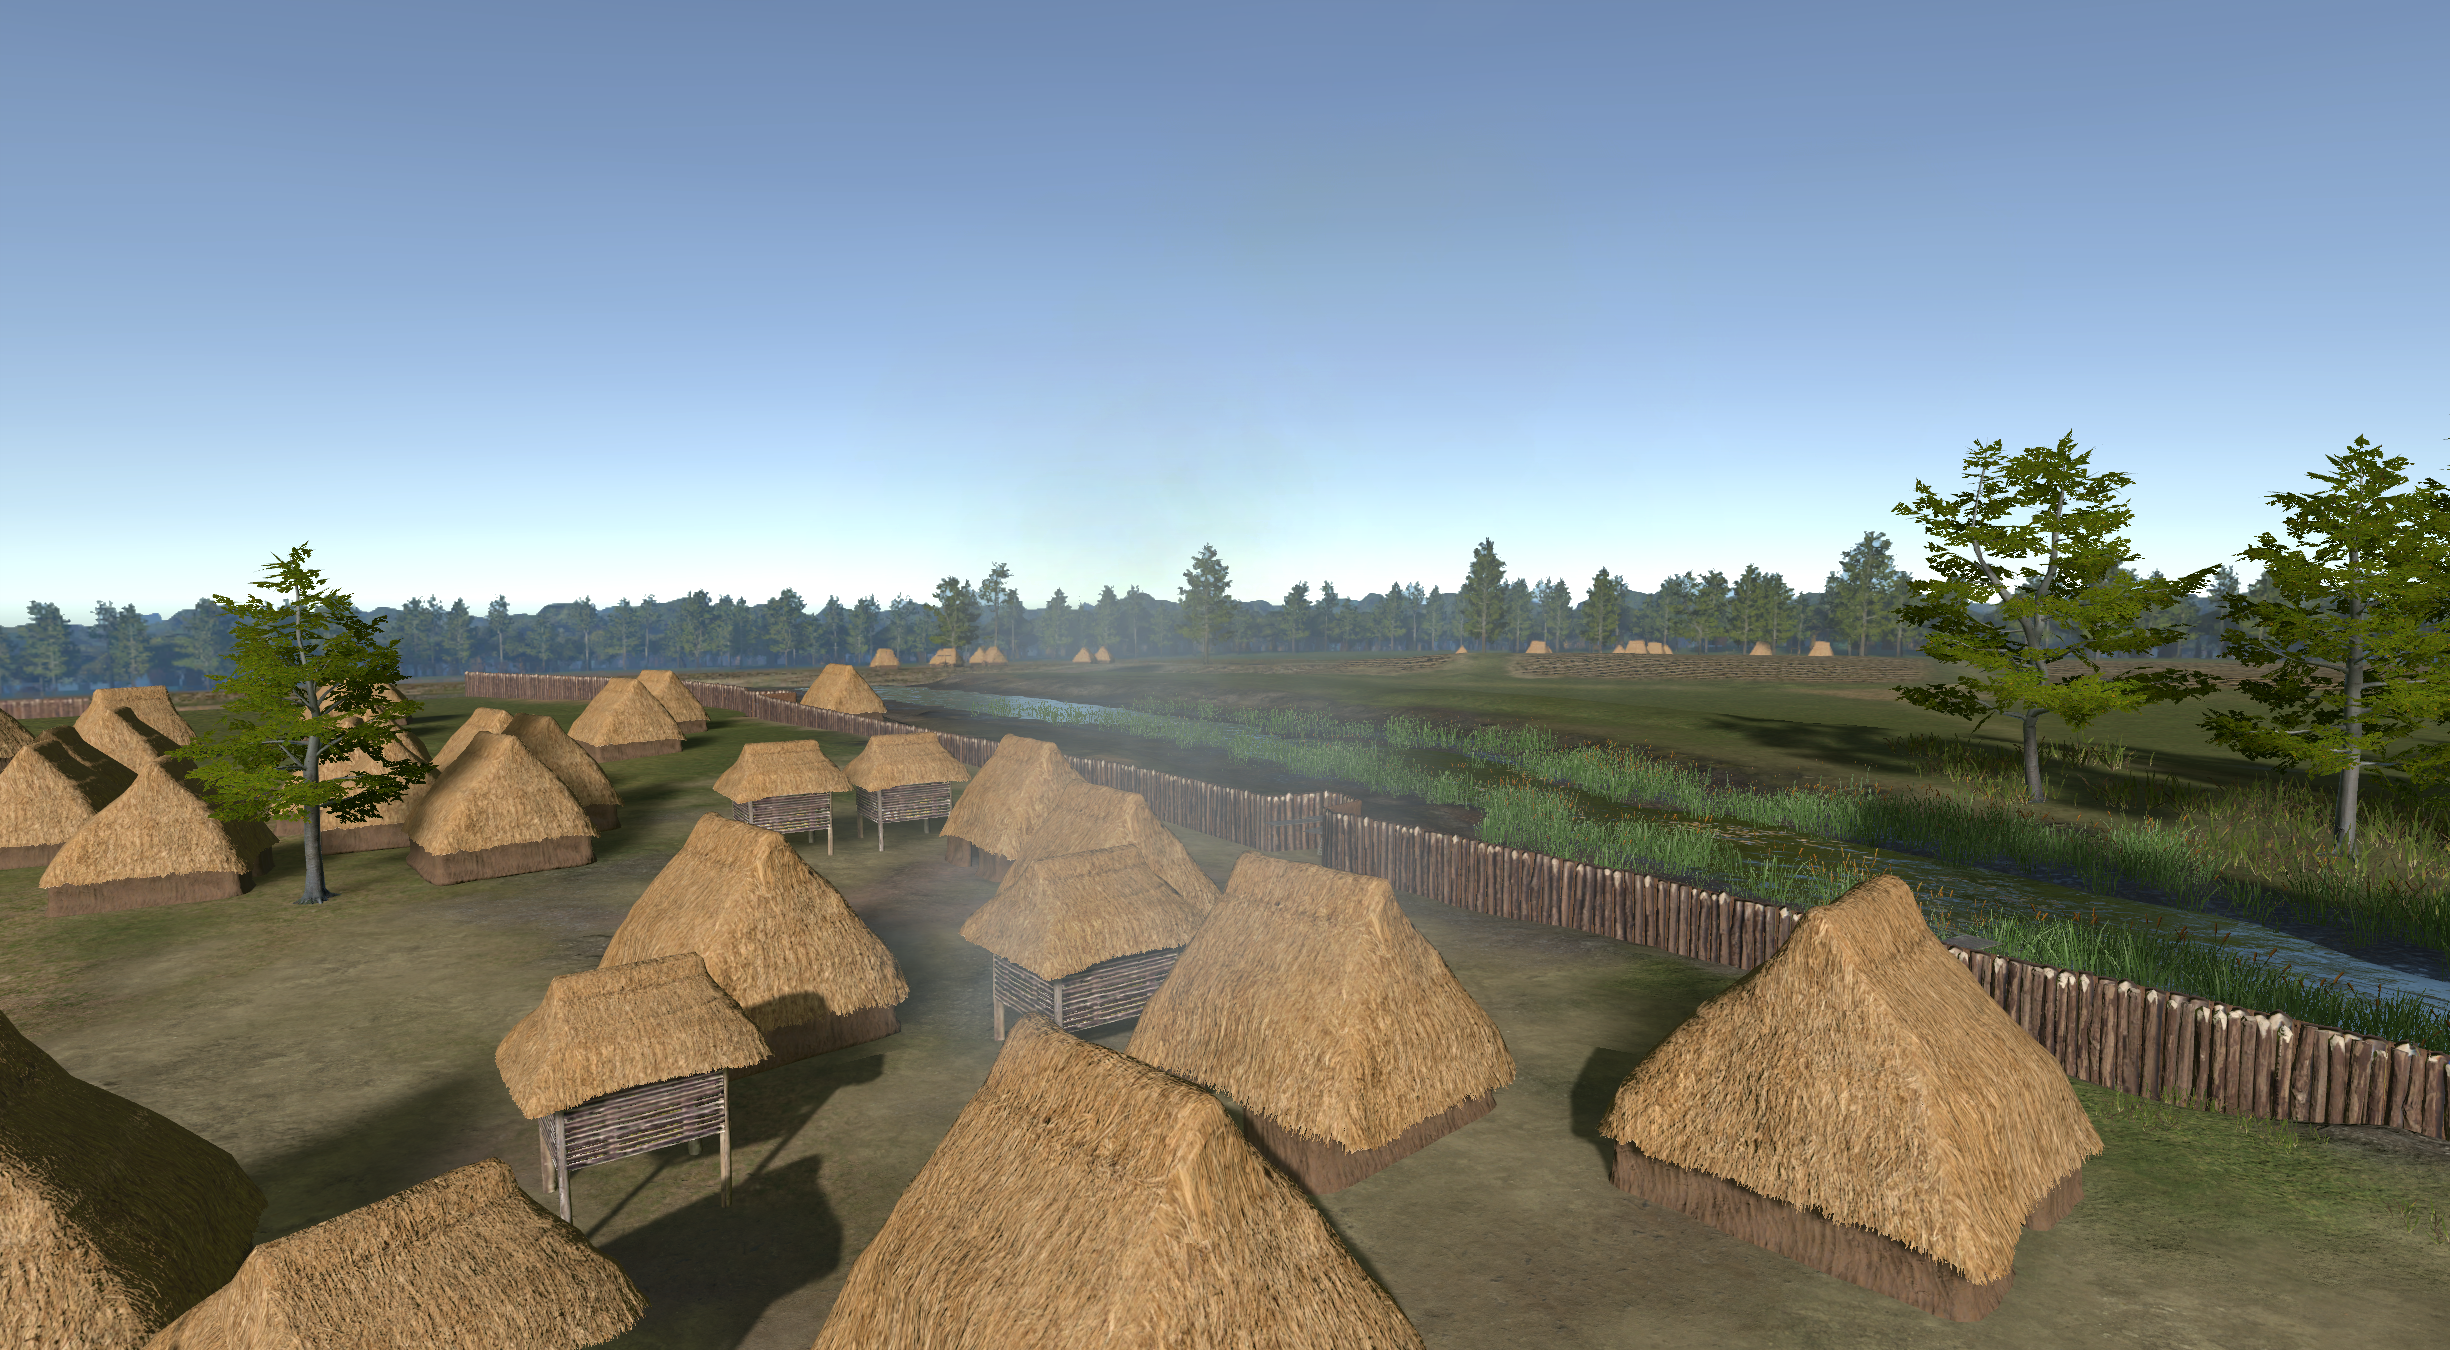
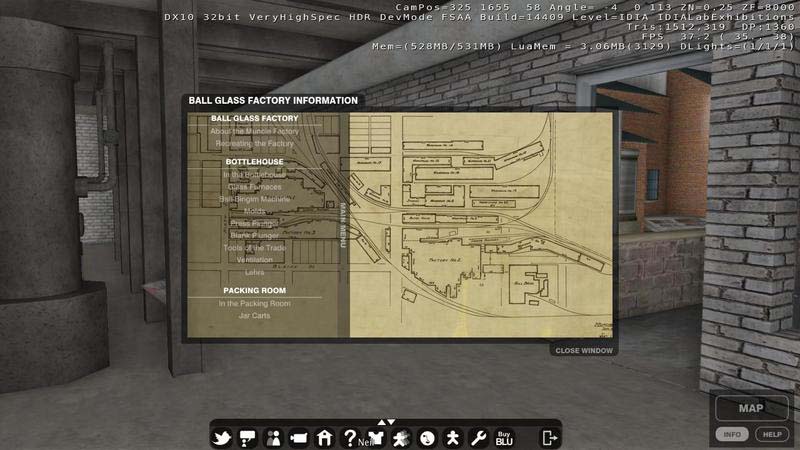
Indiana University Virtual Museum Exhibition Opens
BSU IDIA Lab recently launched its virtual reality exhibition interpreting the Angel Mounds heritage site at the Indiana University Museum of Archaeology and Anthropology (IUMAA). The gala ribbon cutting event opened a portion of the collections of the former Glenn Black Laboratory of Archaeology and the Mathers Museum of World Cultures. The diverse collections at IUMAA relate to dynamic societies from around the world and contain over five million objects of cultural heritage and archaeological significance.
The virtual exhibit, entitled City on the River, is a large scale immersive 360 degree VR CAVE experience which place viewers in the community on the Ohio river over 900 years ago. The simulation provides learning experiences regarding the agriculture, construction techniques, hunting, fishing, gathering and astronomical alignments of the Mississippian peoples.
The Indigenous Peoples built sturdy walls to protect their relatives and great mounds of earth. These structures were designed to align with the movements of the sky – the sun, stars, and moon. Then, after 300 years of continuous inhabitation, the Indigenous Peoples of this great town decided to leave their fields and mounds behind.
The larger exhibition will tell the story of the People who lived there through material culture from the site, the IDIA immersive virtual reality experience, connections to the stories of contemporary culture-bearers, and art from Indigenous descendant communities.
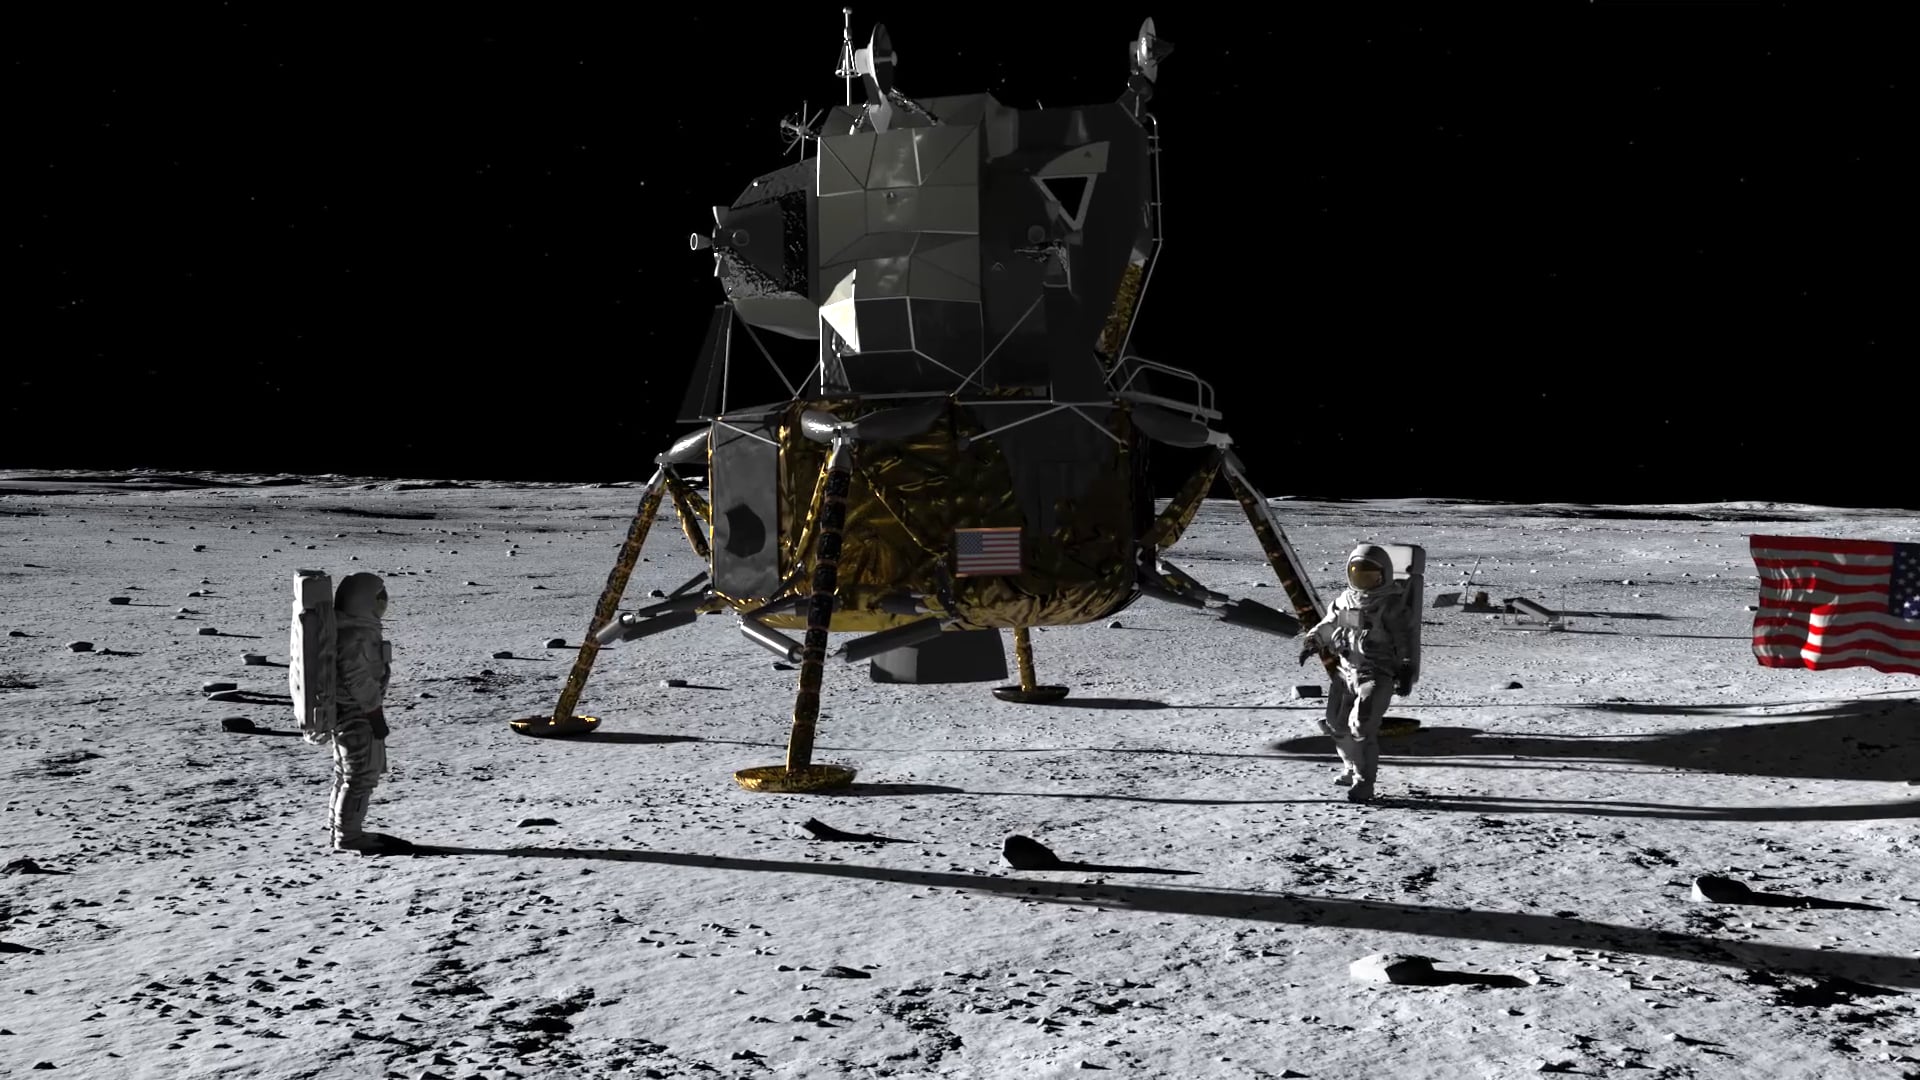
3D simulation of Apollo 11 landing created for the John F. Kennedy Library’s 50th Anniversary of the Apollo 11 Mission. Produced for the International MoonBase Alliance. Produced by the Institute for Digital Intermedia Arts at Ball State University. https://idialab.org/
About IMA
The International MoonBase Alliance (IMA) is an association comprised of leading scientists, educators, and entrepreneurs from space agencies and industries worldwide to advance the development and implementation of an international base on the Moon.
Our priority is to create an action plan that will culminate with the building of MoonBase prototypes on Earth, followed by a sustainable settlement on the Moon. Building on discussions and recommendations from the Lunar Exploration and Analysis Group (LEAG), the European Lunar Symposium, the International Space Development Conference, the NewSpace Symposium, the International Astronautical Congress (IAC), and other worldwide space forums, we intend to formulate an integrated strategy for establishing a proposed multinational lunar base.
Towards this goal, the IMA hosted a 2017 summit last October on Hawaiʻi’s Big Island and invited leading aerospace, engineering and space industry professionals for a series of conferences focusing on identifying essential resources and technological capabilities required to enable and sustain lunar-based operations. Through the promotion of international collaborations and public-private partnerships, we can reduce costs, enhance benefits, and accelerate timetables for lunar settlements.
https://moonbasealliance.com/
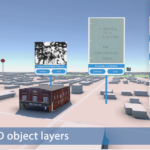
IDIA Lab: Deep Mapping Platform – Unity / ArcGIS (DMP)
Features:
Map Layers
Progressive Global Maps and ArcGIS data integrated into platform
Map view – selectable integrated ArcGIS Maps
Maps provide teleportation to targeted locations
Togglable map layer integration (i.e., Sanborn, Cadastral, Topographic) through UI or browser
3D Object Layer
Live import 3D building layers from OpenStreetMap with Level of Detail (LOD)
Geolocated custom 3D buildings – interactive object layers – historical timelines
Embedded Virtual Worlds
Immersive 3D embedded virtual worlds – single player or multiplayer – shared live events, etc.
AI 3D chatbot characters
Interactive 3D objects triggering text panels, video, audio, and data
User Interface
Extensible User Interface
Geolocated media, data, and information
Live API calls to browser-based archives
Embedded browser video and audio links
Navigable hotspot pinned locations
Selectable era timelines
Media and PDF viewing through UI or open in brows
PROTOTYPE PROJECT:
Deep Mapping Middletown: Designing Immersive Experiences for Spatialized Historical Data James J. Connolly and John Fillwalk
Deep Mapping Middletown seeks to represent in spatial terms the substantial archive produced by research on Muncie, Indiana, USA, the site of Robert and Helen Lynds’ seminal community studies, Middletown (1929) and Middletown in Transition (1937). The success of the Lynds’ work, considered among the most influential interpretations of twentieth-century American life, inaugurated a tradition of using this small midwestern city as a barometer for assessing broader social and cultural trends in the United States. Researchers, journalists, and filmmakers have repeatedly returned to the city over the past century to document social and cultural change, generating an rich multimedia archive that documents local experiences. Most, though not all, of this material is accessible in digital form.
We have begun to build a multi-tiered platform that mobilizes this archive for “deep mapping” the city. By deep mapping, we mean the process of generating user-driven, multimedia depictions of a place. Drawing on postmodern theory, scholars engaged in deep mapping have employed digital technologies to create complex representations of spaces and empower users to explore them from a variety of perspectives. Deep mapping aims to destabilize depictions of place, conveying the multiple meanings that different groups of people have assigned to specific settings and their evolution over time. Our deep mapping platform integrates GIS and immersive 3D simulation technology to provide access to this material and facilitate investigations of spatial-historical experience, including the evolution of racial geographies and the civic and social consequences of deindustrialization.
Part of our aim in this project is to reframe Middletown Studies for scholars, students, and public audiences. While there is an extraordinarily rich collection of Middletown research materials, including extensive published scholarship, hundreds of recorded interviews, thousands of photographs, hundreds of hours of films, survey results, and unpublished research reports, much of the work that produced this archive rests on a problematic premise. The Lynds’ initial investigations neglected Black and other minority experiences, an oversight that many follow-up studies failed to remedy. Only since the 1970s has Middletown research become more inclusive, incorporating the experiences of racial and ethnic minorities that the Lynds and their immediate successors ignored. Recent work has also jettisoned the anthropological gaze in favor of more collaborative approaches that share authority between researchers and community members. A key goal of Deep Mapping Middletown is to elevate this later body of work, using the multivocality inherent in deep mapping to repurpose the Middletown archive as a resource for investigating and empowering the marginalized, not just the mainstream.
In its current, prototyping stage, our project aims to overcome several technical and design challenges. These include:
1. The development and refinement of a Historical Spatial Data Infrastructure (HSDI) that include geolocated historical data from various sources and in various formats (text, image, audio, and video) ingested into a GIS, as well as tools, features, and procedures to manage and facilitate use of the data. A key part of this work is establishing lat-long coordinates for photographs and audio-visual material for passages extracted from textual sources such as oral history transcripts or ethnographic writing.
2. Application of manual and computational techniques developed by various scholars for capturing and representing vague or subjective spatial information in both 2D and 3D. The Middletown archive includes a substantial body of purposely obscured evidence in ethnographic writing, as well as spatial data contained in oral histories and anonymized survey data. While researchers have employed a range of visualization techniques that extend beyond traditional coordinate-based cartographic methods to represent these kinds of data, we are especially interested in approaches that link vague and subjective experiential evidence to coordinate locations.
3. Development of the interface between a Unity-based virtual environment and a GIS-based HSDI that enables users to engage with the spatial data we are assembling.
4. Development of a virtual environment that includes in-world visual cues modeled on game analytics, such as heat maps and dwell times, that visualize spatial data, including affective and sensory experiences, documented in Middletown research.
Working with a team of scholarly advisors, librarians, designers, and developers, we have produced an initial GIS that includes geolocated sample data for a single neighborhood drawn from collections of photographs, oral histories, and ethnographies. We have also developed a 3D immersive space using the Unity game engine, employing the ArcGIS SDK for Unity to integrate our GIS and 3D model, giving users access to spatial data within our immersive environment. We are also currently creating role-playing experiences that limit access to spaces and information depending on the role adopted by the user and the period selected. These experiences are derived from spatial data in the Middletown archive. We will also follow best practices for heritage visualization as described in the London Charter by making paradata that documents our interpretive choices available to users.
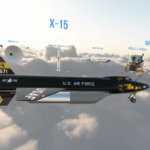
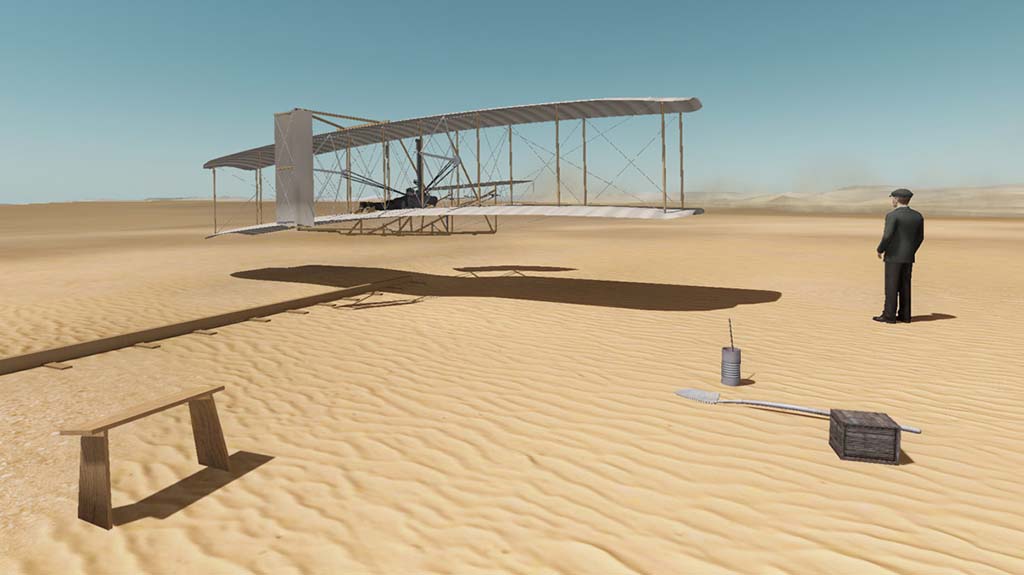
BSU IDIA Lab developed Virtual Milestones of Flight, an immersive head mounted display prototype designed for the permanent exhibition at the Smithsonian Air and Space Museum in Washington, DC.
Both the exhibition and simulation celebrate selections of the most significant airplanes, rockets, and spacecraft in history. Some of these craft incorporated into the simulation include: Charles Lindbergh’s Spirit of St. Louis, the X15, a hypersonic rocket powered USAF aircraft, the Wright Brothers’ flyer, Sputnik, the first Russian artificial satellite, and NASA’s Apollo 11 Lunar Lander.
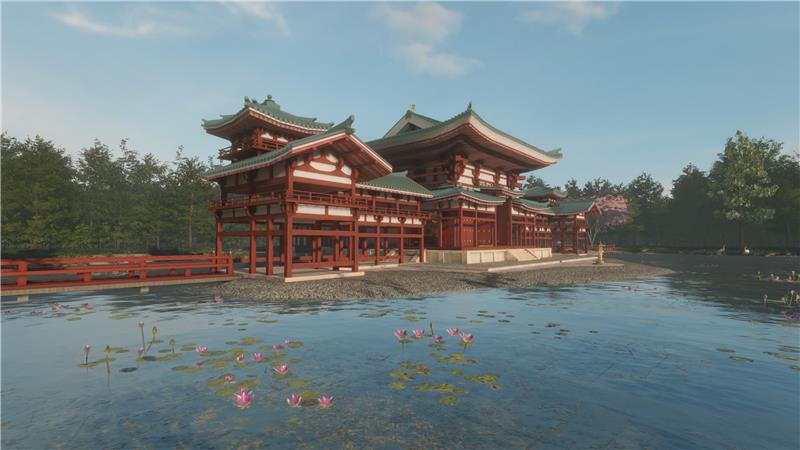
Experience Byōdō-In, by IDIA Lab, is an immersive virtual tour exploring the richness of Japanese heritage. Virtually travel to the past to interact with this important historical temple complex. The simulation provides users with elements such as detailed 3D models, interactive zones, animated characters and fauna, and user interfaces to learn about the significance of this UNESCO World Heritage site. Byōdō-In is located in Uji, Japan (near Kyoto) and was originally built in 998 AD and was converted into a Buddhist temple in 1053 AD, honoring Amida Buddha and supported by both Jōdo-shū (Pure Land) and Tendai-shū Buddhists. This VR application has been designed with the Unity game engine for use in Powerwalls, CAVE and HMD systems.
BSU’s IDIA Lab was contracted by the Mellon Foundation Humanities Virtual World Consortium to design and develop a major open source virtual world initiative for Digital Humanities and Cultural Heritage projects. The consortium – comprised of Kings College, London; UCLA; the University of Virginia and Trinity College, Dublin – turned to the expertise of BSU’s IDIA Lab to create this two-year innovative hybrid simulation platform that leverages new modes of teaching and learning in immersive environments.
http://virtualworlds.etc.ucla.edu
Concurrent with the development of the prototype infrastructure, members of the Consortium developed working relationships with Ball State University’s IDIA Lab, an internationally recognized academic leader in in the development of virtual worlds, human computer interaction, visualization and 3D simulation. Most important for the Consortium, the IDIA Lab is engaged in the development of scholarly, creative and pedagogical projects that explore the intersection between the arts, science and technology. The IDIA Lab is not merely a technical development team, but is also a interdisciplinary design studio that integrates art and emergent technologies into every phase of development. After inviting John Fillwalk, the lab’s director, to attend a series of conference calls with the consortium, a proposal for interface and in world design was solicited. John Fillwalk is an internationally recognized artist and developer of virtual and hybrid environments. He serves as the senior director of the Hybrid Design Technologies initiative [HDT], professor of Art and as the director of the Institute for Digital Intermedia Arts [IDIA Lab} at Ball State University. Over the past 25 years, his interactive and virtual artworks have been exhibited internationally in numerous festivals, galleries and museums including SIGGRAPH, CYNETart, Synthése, 404 Festival, Dutch Design Week, Boston Cyberarts, Virtual Broad Art Museum, ISEA, ASCI, VIdéoformes, Indian Institute of Technology and the Beijing Science and Technology Museum.
The Consortium elected to partner with the IDIA Lab, since it offers design as well as technological expertise and a common interest in the theoretical implications of Virtual World technologies on research and pedagogy.
Development will be split between the two independent teams, with the IDIA Lab, in general, centering its work on the development of the Unity based platform including avatar selection, navigation, network controller, user interface system, and back end network hosting, while Tipodean develops the HTML and KML system and works with members of the Consortium to integrate the four individual projects into the shared platform. The development will not occur in isolation from the rest of the Consortium. The external development teams will offer scheduled monthly training sessions to the internal technical teams of the Consortium. We are employing a similar development model to that successfully used during the Planning Phase of the HVWC in which, through a collaborative effort of local staff and third-party developers, we implemented a prototype template and virtual world environment with a subset of features below enabled. In addition, we plan to hire a graphic design independent contractor and a game design independent contractor to work with the PIs and our development teams on the look and feel of the Consortium’s web presence as well as the conceptualization of the interface design.
Our Mission
I. Project Summary
The 1990s saw the development of digital technologies supporting the 3D (three dimensional) modeling of cultural heritage objects and environments. For the first time, humanists could digitally model and reconstruct the damaged or vanished monuments of the past. The results were typically 2D renderings or videos (“animations”). The decade of the 2000s saw the enhancement of 3D environments with avatars making it possible for scholars to enter into the 3D world and to use the Internet to interact with the simulated environment while communicating with fellow humanists located anywhere on the planet. Such software platforms are called networked virtual worlds (NVWs). The Humanities Virtual World Consortium (HVWC) will explore how the unique characteristics of networked virtual worlds can enable and advance humanistic research while working towards creating a sustainable base for mainstreaming the technology in humanities scholarship. Our initial work is based upon a series of related scholarly initiatives that draw upon virtual world technology and which are meant to: a) advance the current state of research on the phenomenology of space and place, b) design visual and aural conventions to evoke the sensorial experience lost to us due to technological and evidentiary constraints, c) test the current capabilities of virtual worlds to explore chronotopic problems, previously inaccessible due to the limitations of prior technology, d) guide future development of humanities-driven virtual worlds, and e) produce works of exemplary digital scholarship, disseminated in formal, peer-reviewed publications, that solve specific research problems in particular disciplines and area studies. Our overall intent is to demonstrate how networked virtual worlds can uniquely enable important kinds of research inquiry, and thus contribute to the transformation of scholarly communication in the relevant subject fields and to the field of digital humanities. With this in mind, our projects have been chosen so that they span multiple disciplines— including Archaeology, Art History, Architectural History, Buddhist Studies, Classics, History, Irish Studies, Literary Studies, Tibetan Studies—and periods from the ancient past to contemporary times. While the projects explore discipline-specific research questions, they share common goals concerning humanities research and scholarly communication in a networked virtual world environment.
II. Expected Outcomes and Benefits of the Project
Project Deliverables: At the conclusion of the project we will release a networked virtual world platform template to be used in the Unity game development engine, the Consortium web site with documentation, four virtual world projects released as Unity3D builds, four draft in-world “articles” embedded within the virtual world project, and four articles submitted for peer review in journals devoted to specific scholarly domains.
The main outcomes of the proposed project will be (i) the consolidation of the Humanities Virtual World Consortium as a robust, fully functional academic organization that can persist and expand in the future; (ii) the development of a shared virtual world platform that is adapted for maximum utility for scholarly projects; (iii) the publication of four significant scholarly projects in that platform that exemplify the way in which virtual worlds offer unique affordances for scholarly research inquiries; (iv) individual articles based on the virtual world content submitted journals in our traditionally-defined, domain-specific fields. At the conclusion of the grant, a) the organization will be published on the web with bylaws and an means for others to join, b) the new collaboratively maintained virtual world research and publication environment will host four scholarly publications products, and c) the shared development template and accompanying documentation will be made available online to aid others in the development of Virtual World content. The primary benefit of this project is that it constitutes a valuable and necessary step towards establishing the organizational and technical basis for a sustainable scholarly exploration of the unique ways in which networked virtual worlds can enable and advance humanistic research. While valuable and compelling individual projects have emerged over the past years, interoperability between them has not been supported. The barriers remain extremely high for individual scholars who wish to use this medium for their own research without major funding. For these reasons, to date these projects have failed to attain a wide scholarly audience. We propose to establish an organization, technology, and specific scholarly publication apparatus that would address these deficiencies in the subsequent years and beyond.
The broader, long-term, and more far-reaching benefits are that the initiative will establish a basis for the scholarly community to engage in a serious attempt at creating a sustainable, shared environment for scholarly research and communication to be done in a networked virtual world environment. These publications will show the viability and importance of such research, raise its profile in the scholarly community, and demonstrate in a compelling, virtually tangible, and accessible way the benefits of using a shared platform. Such publications will, it is envisioned, lead to an expansion of the Consortium and finally the development of a robust platform in which scholars can easily participate without the need for major grants to support further development of one-off technologies. Scholarly projects from disparate disciplines and geographical regions would be interoperable, and scholarly use would be widespread due to the consistency of interface and technology.
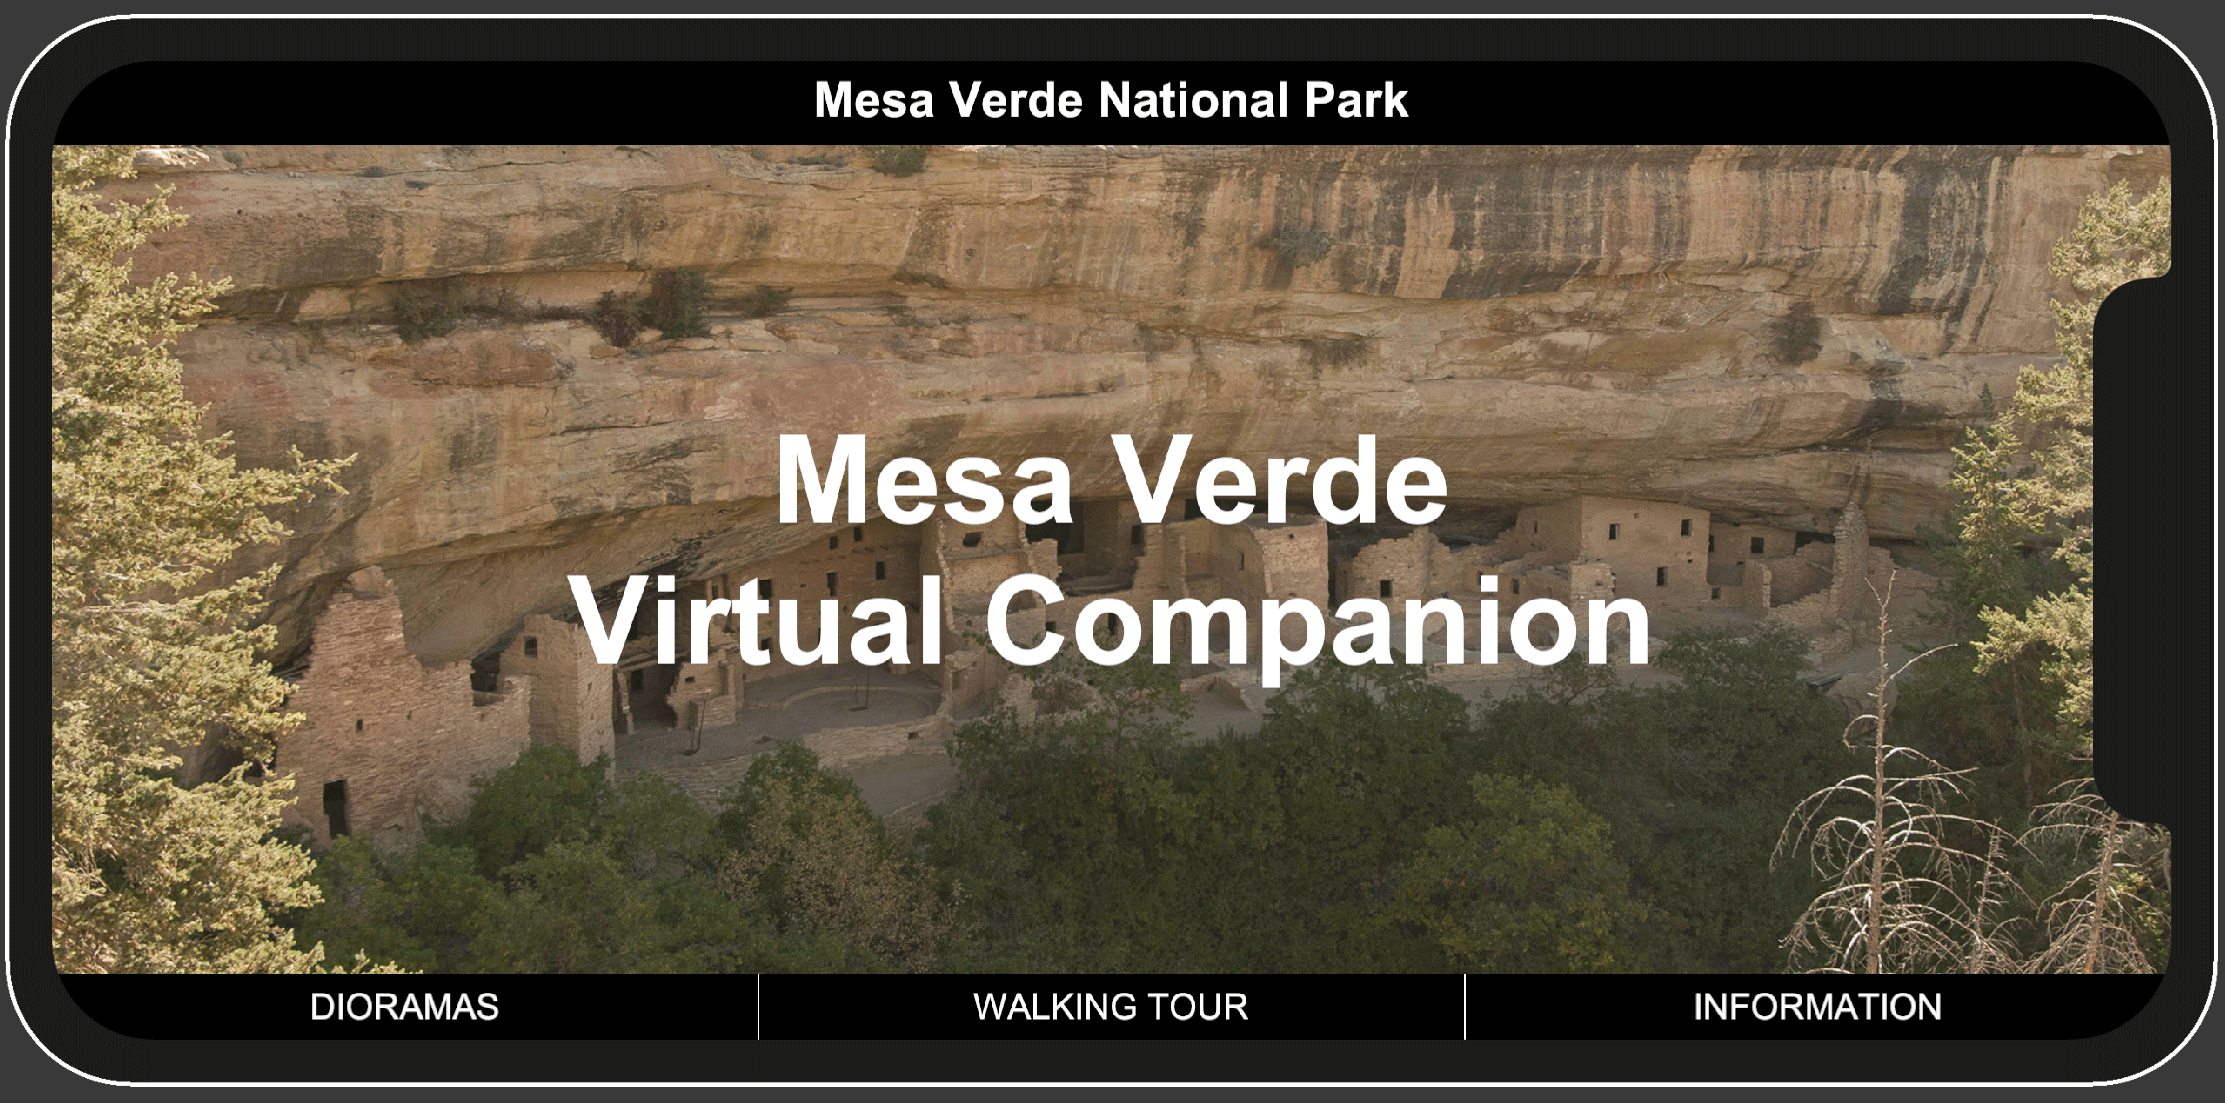
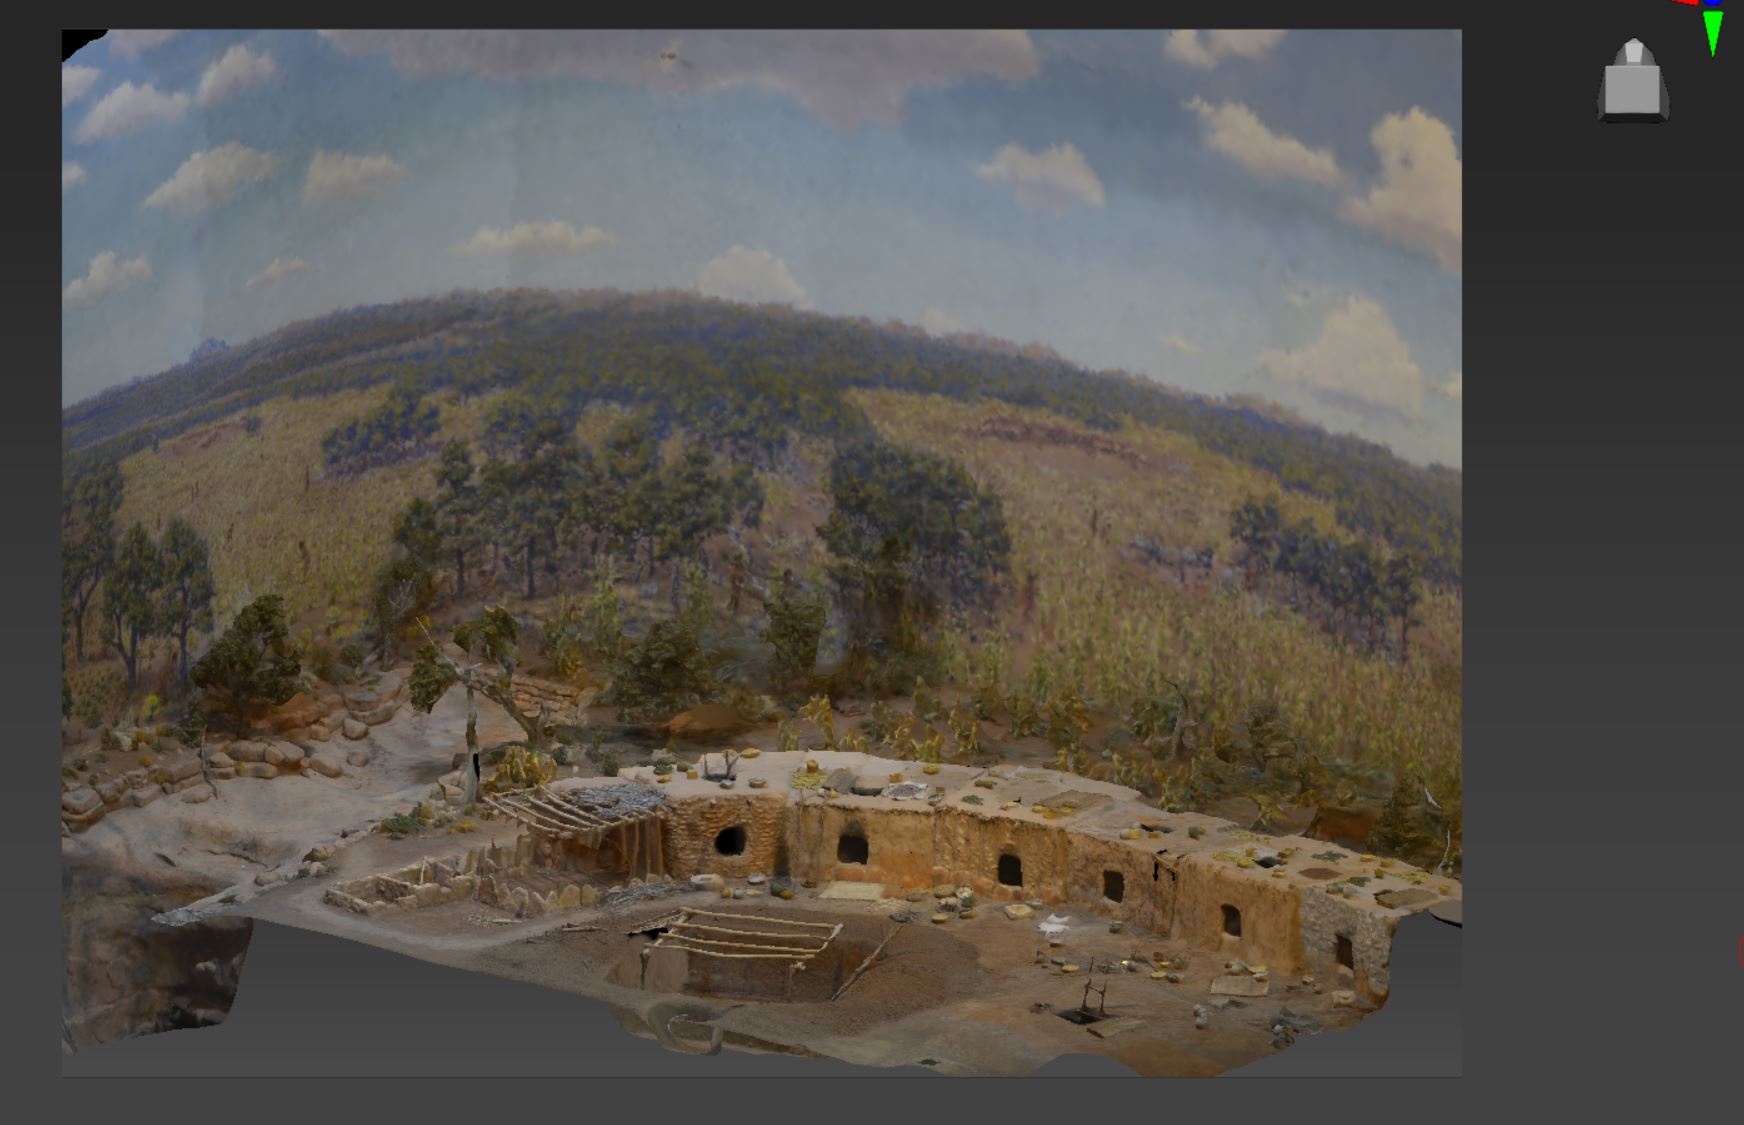
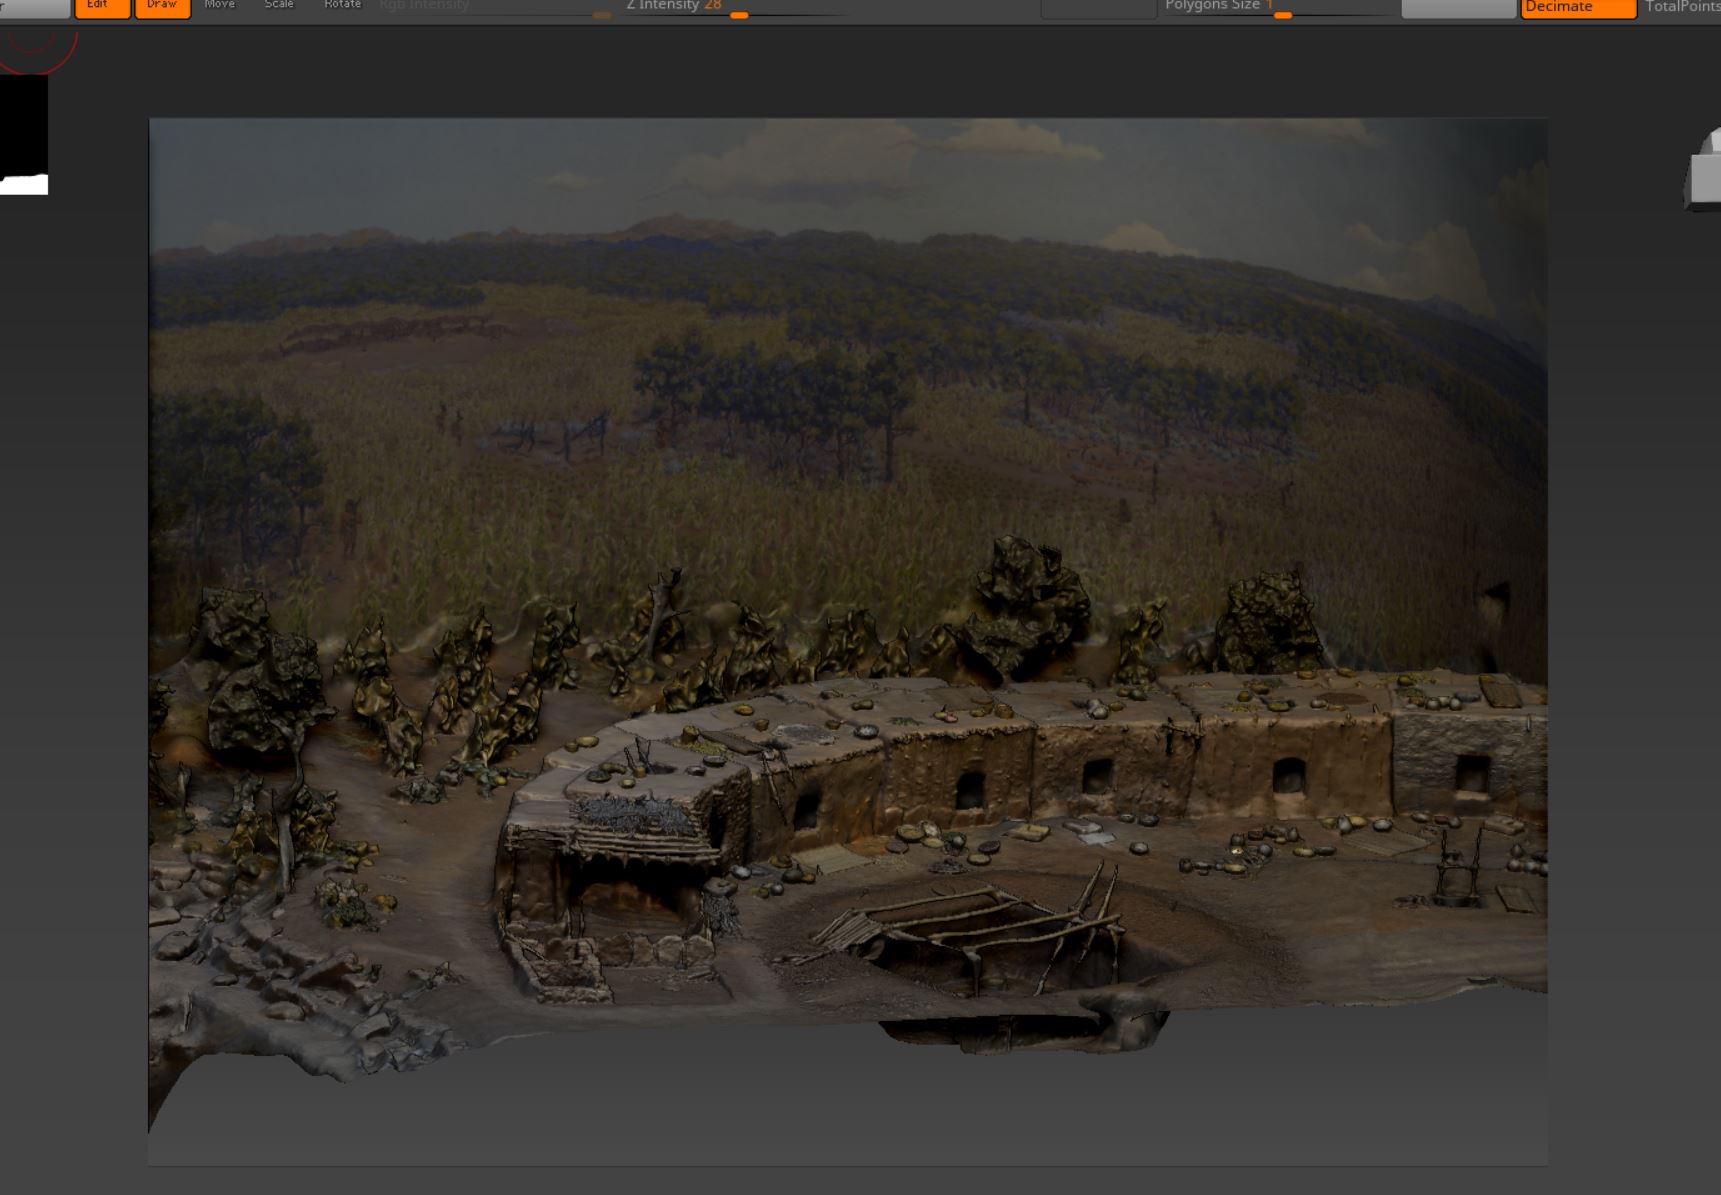
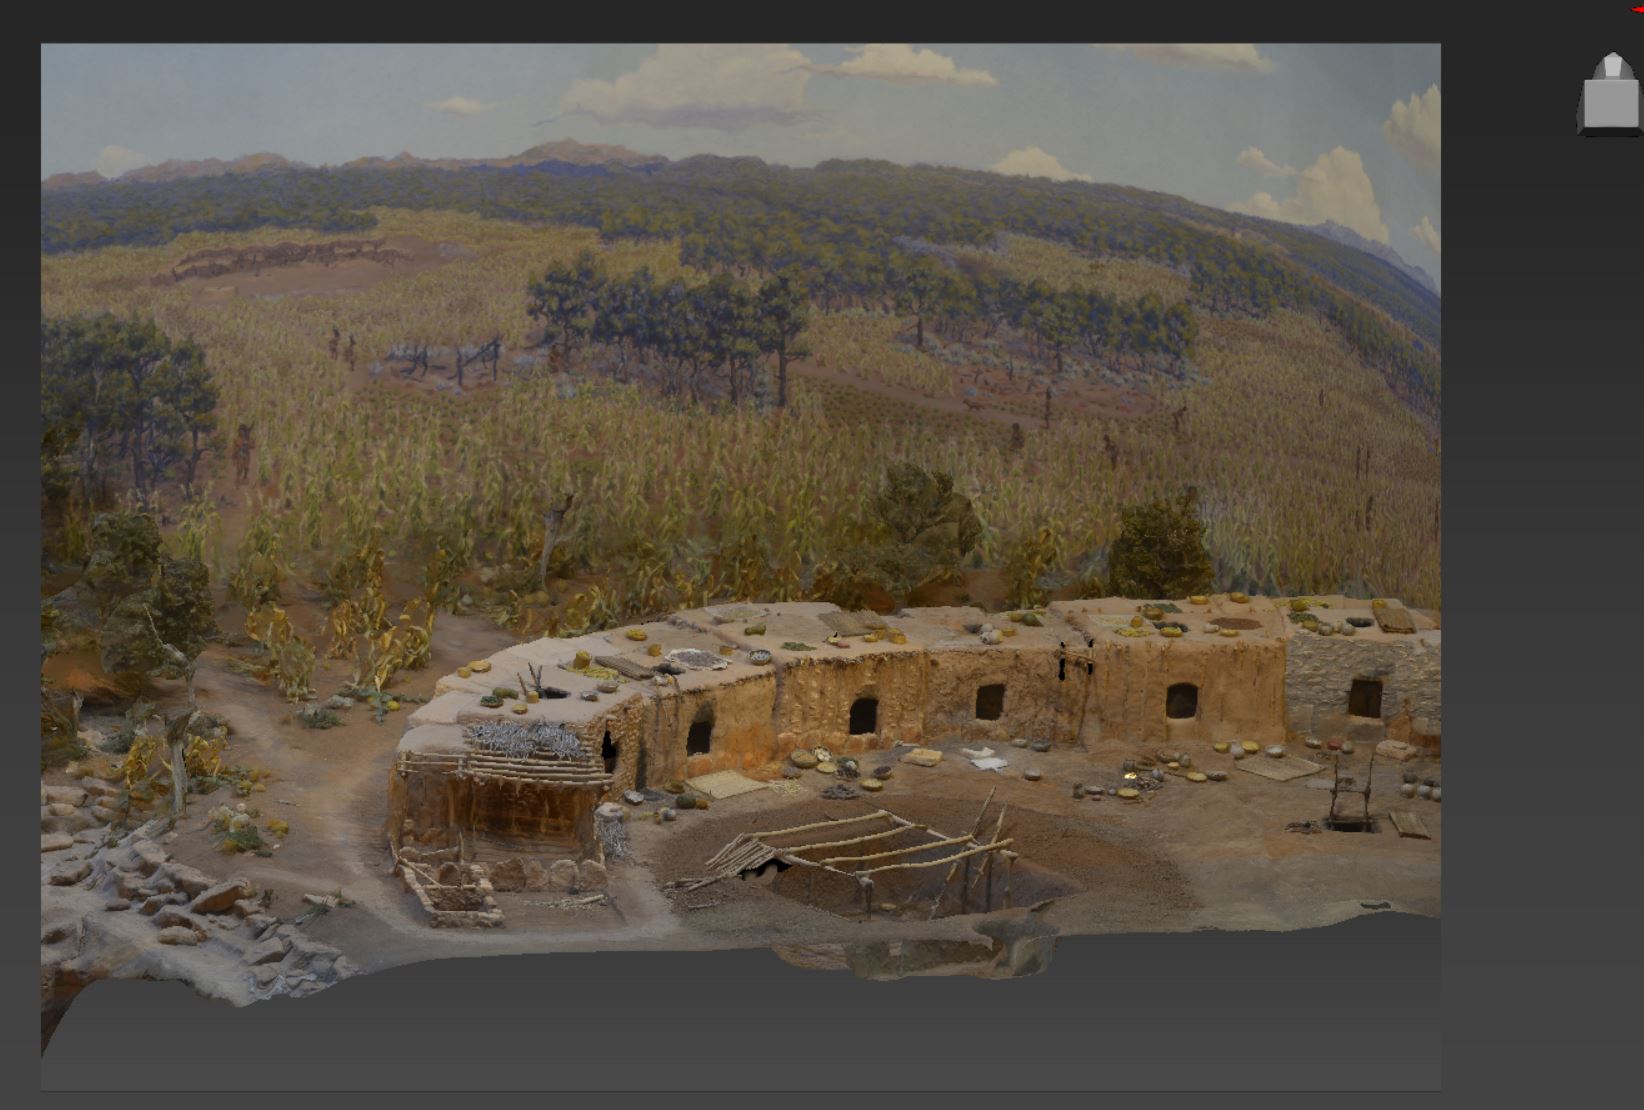
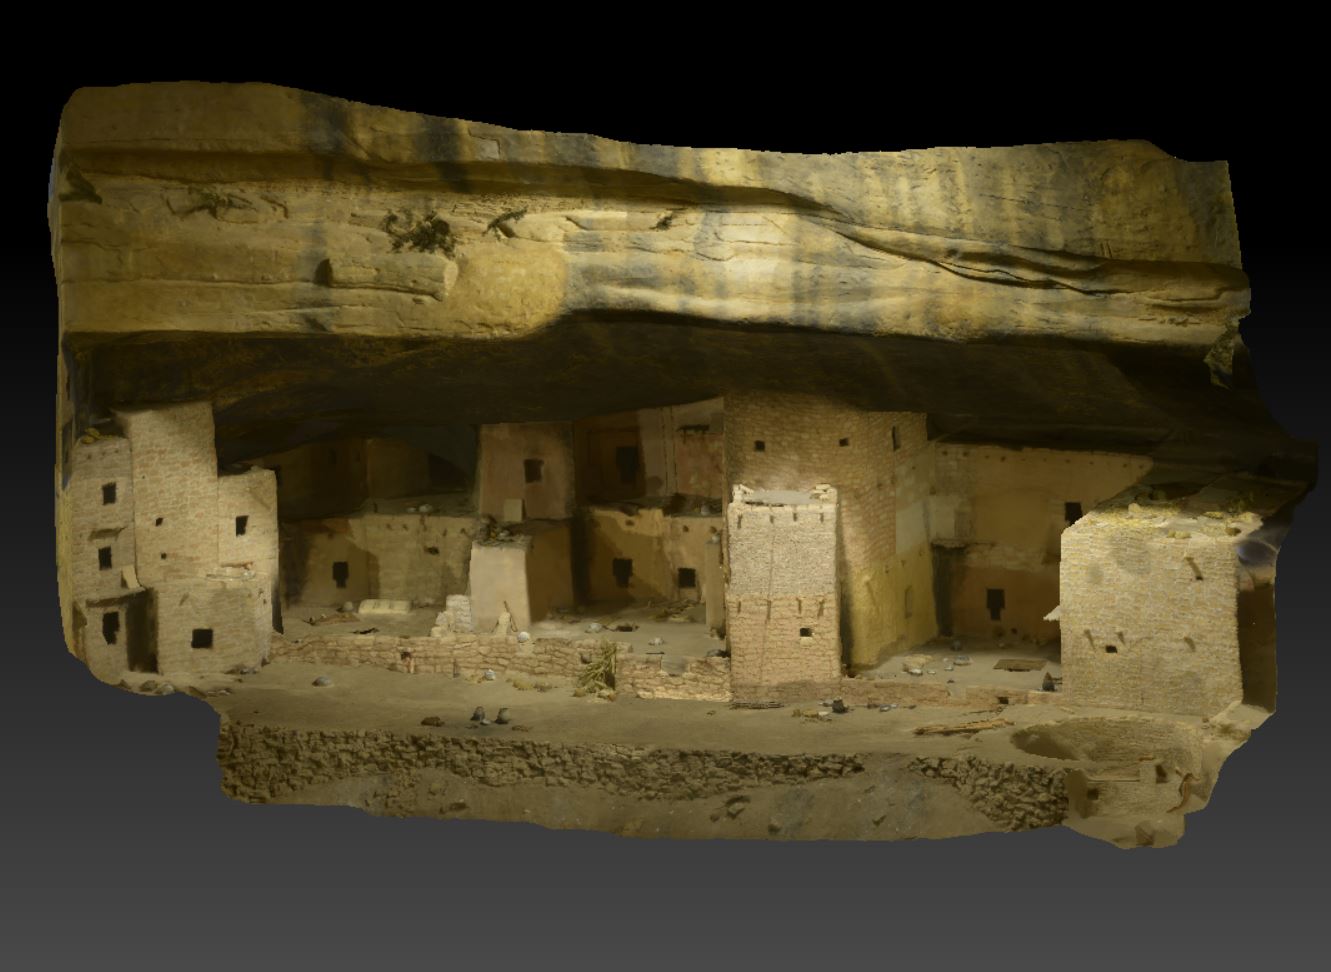
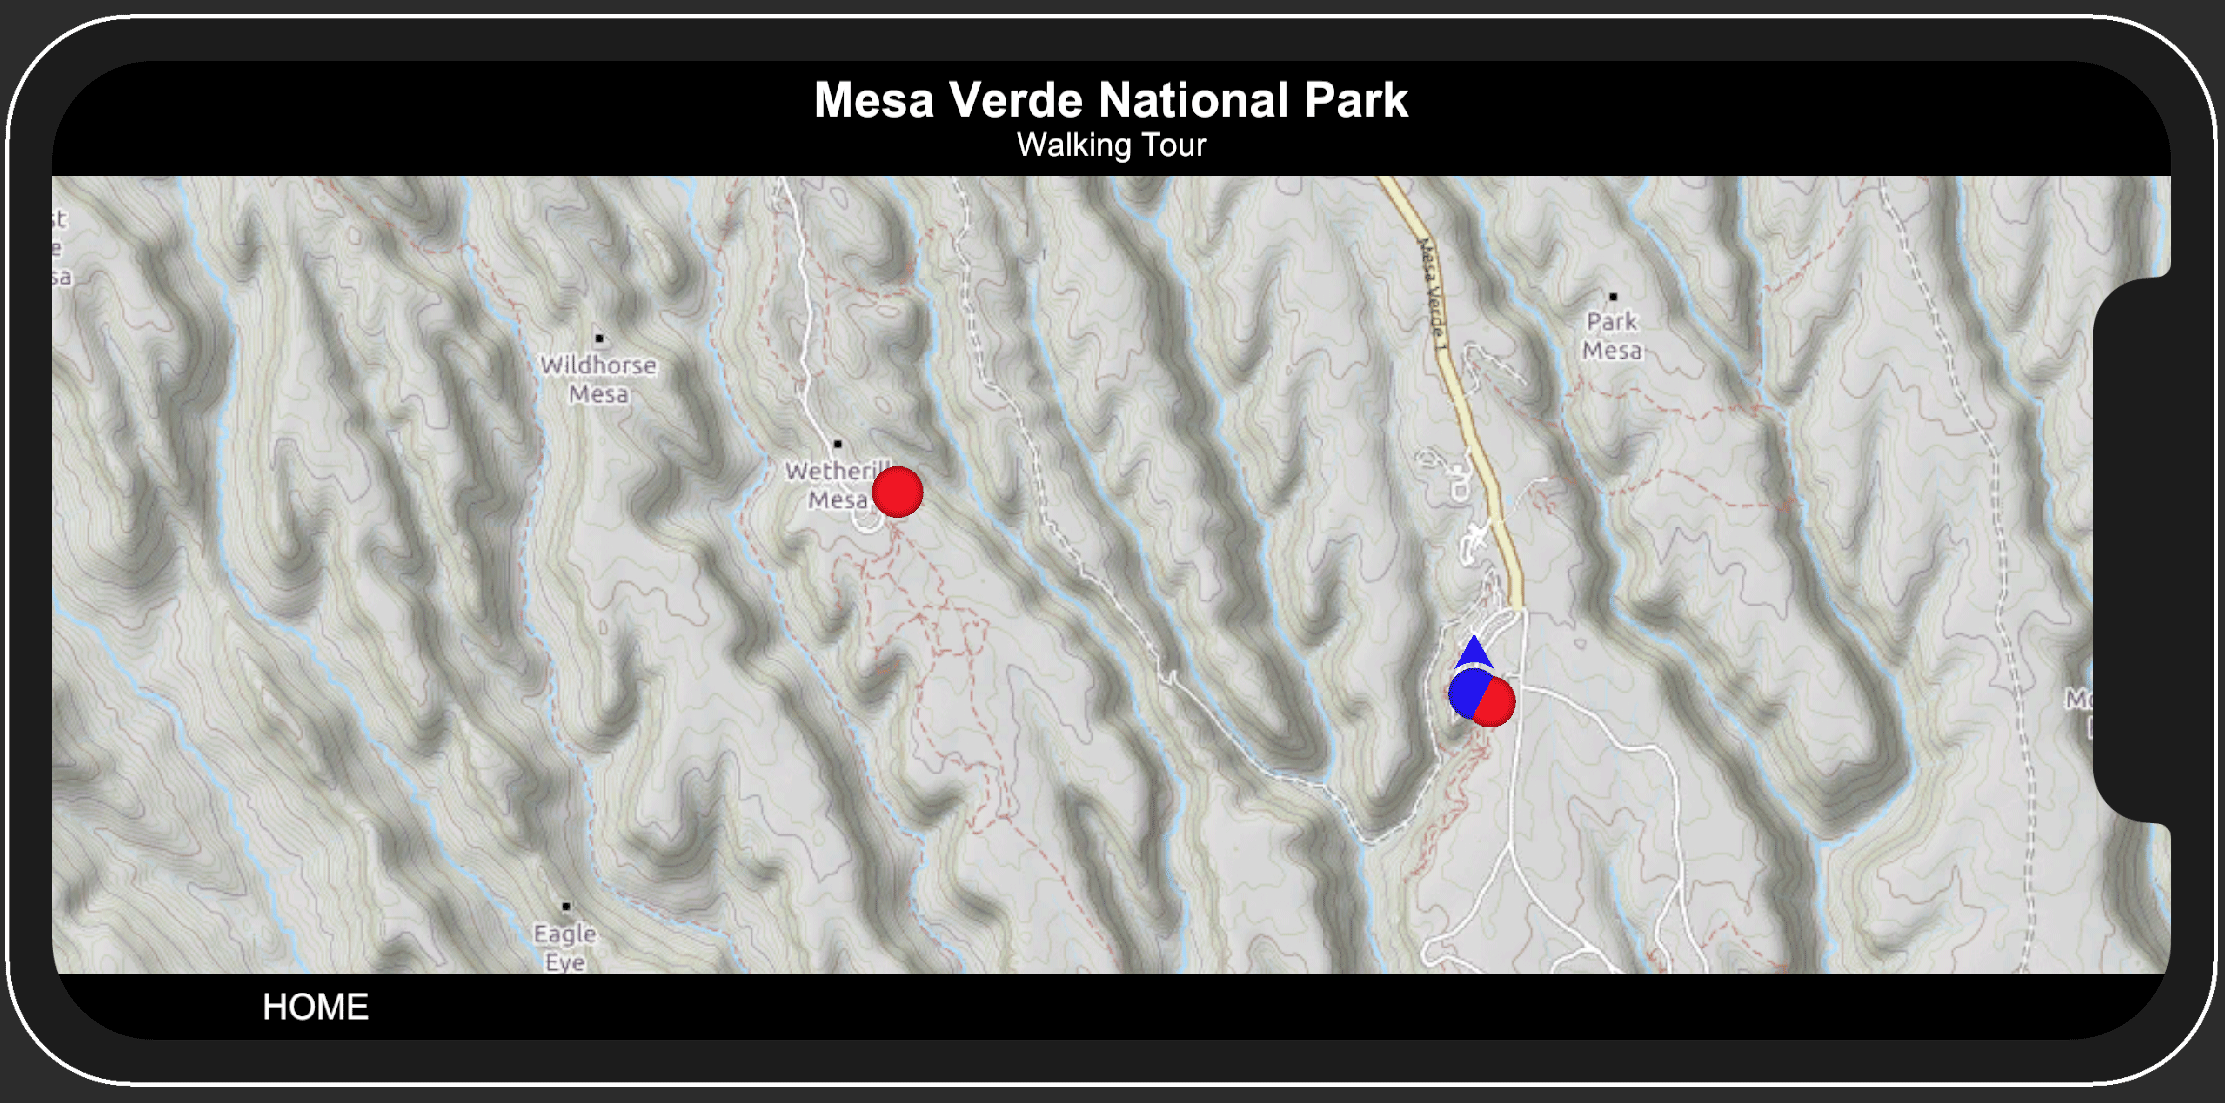
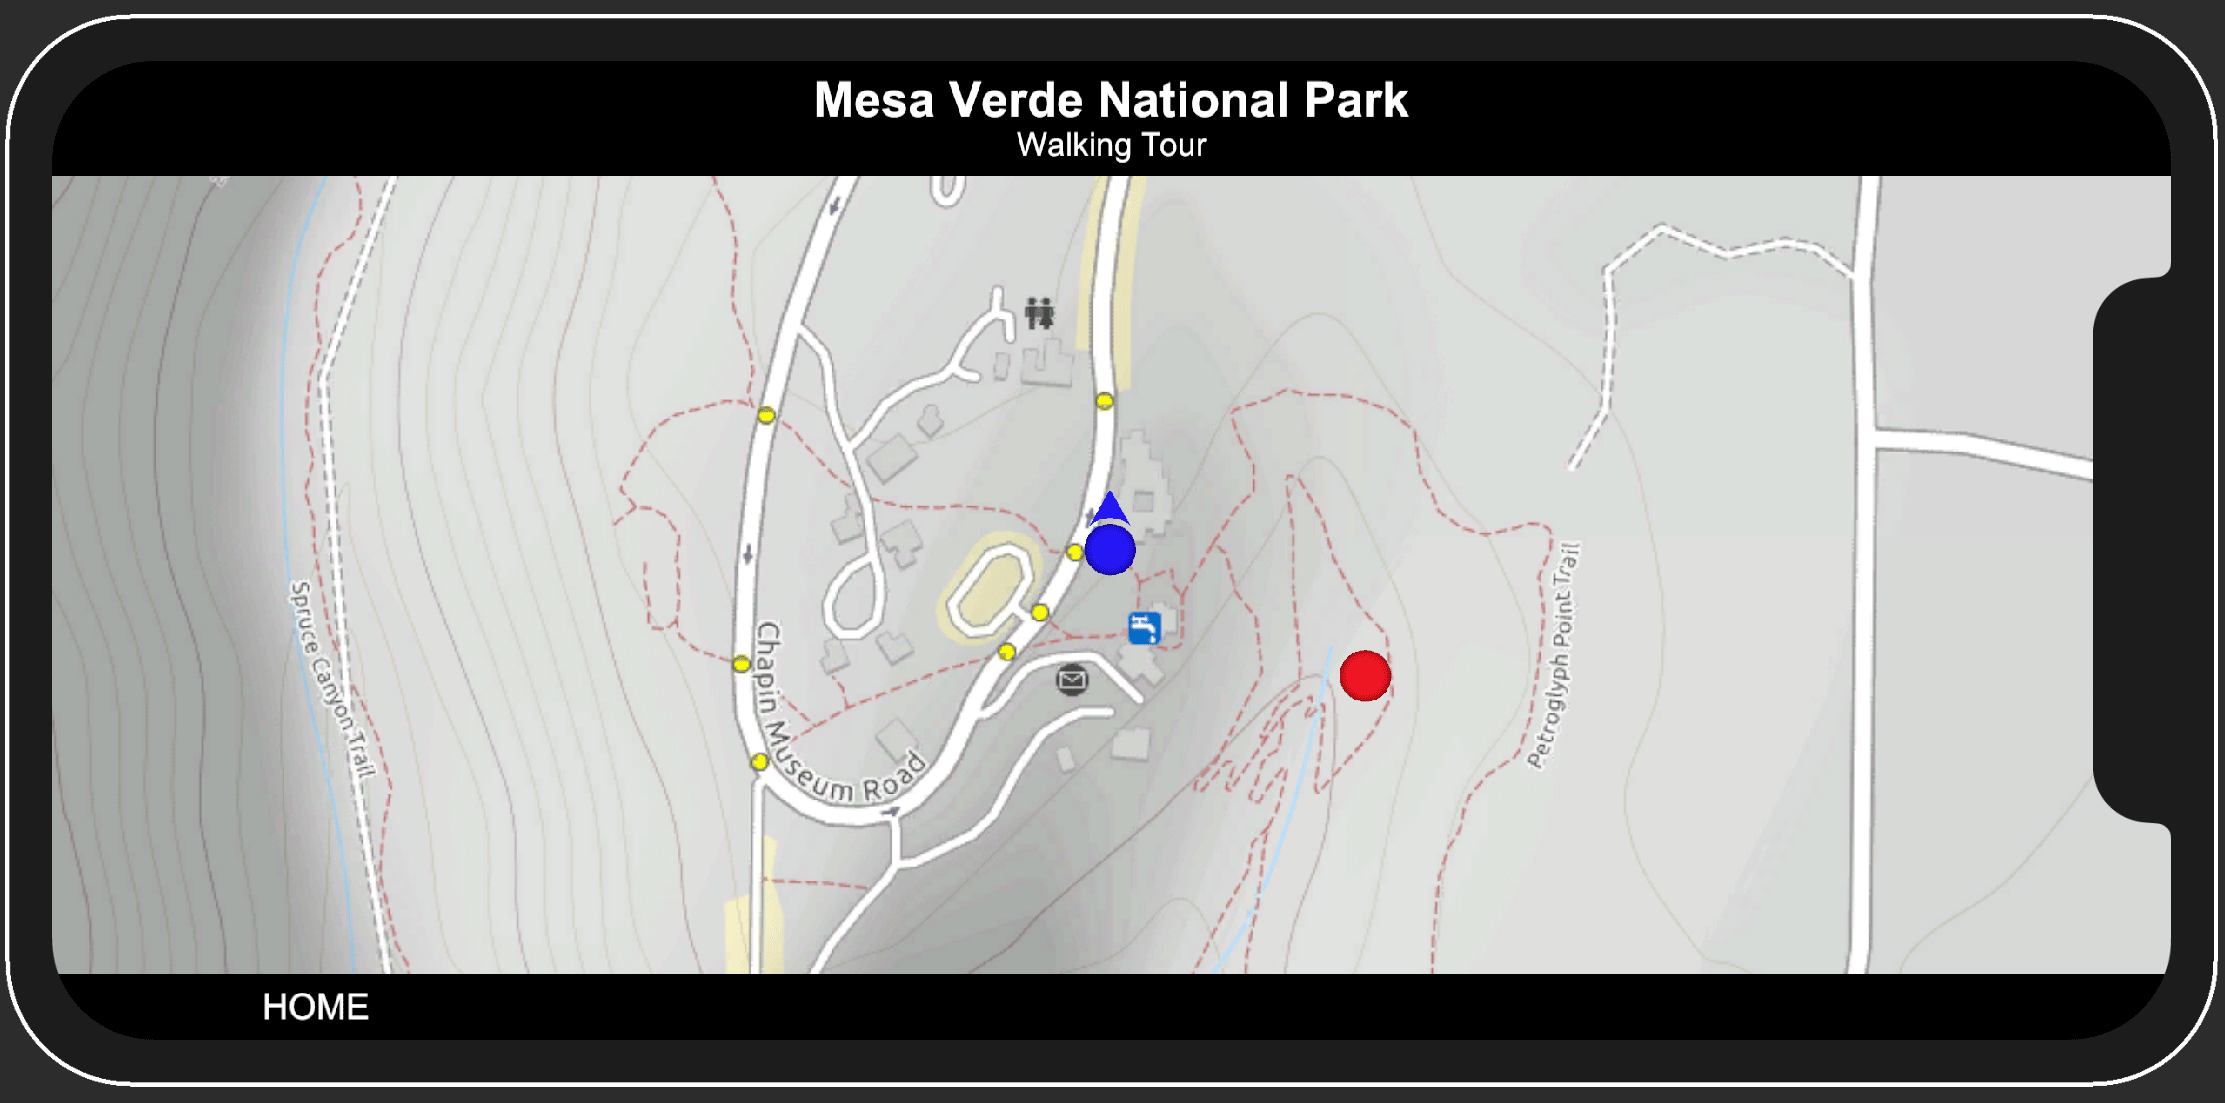
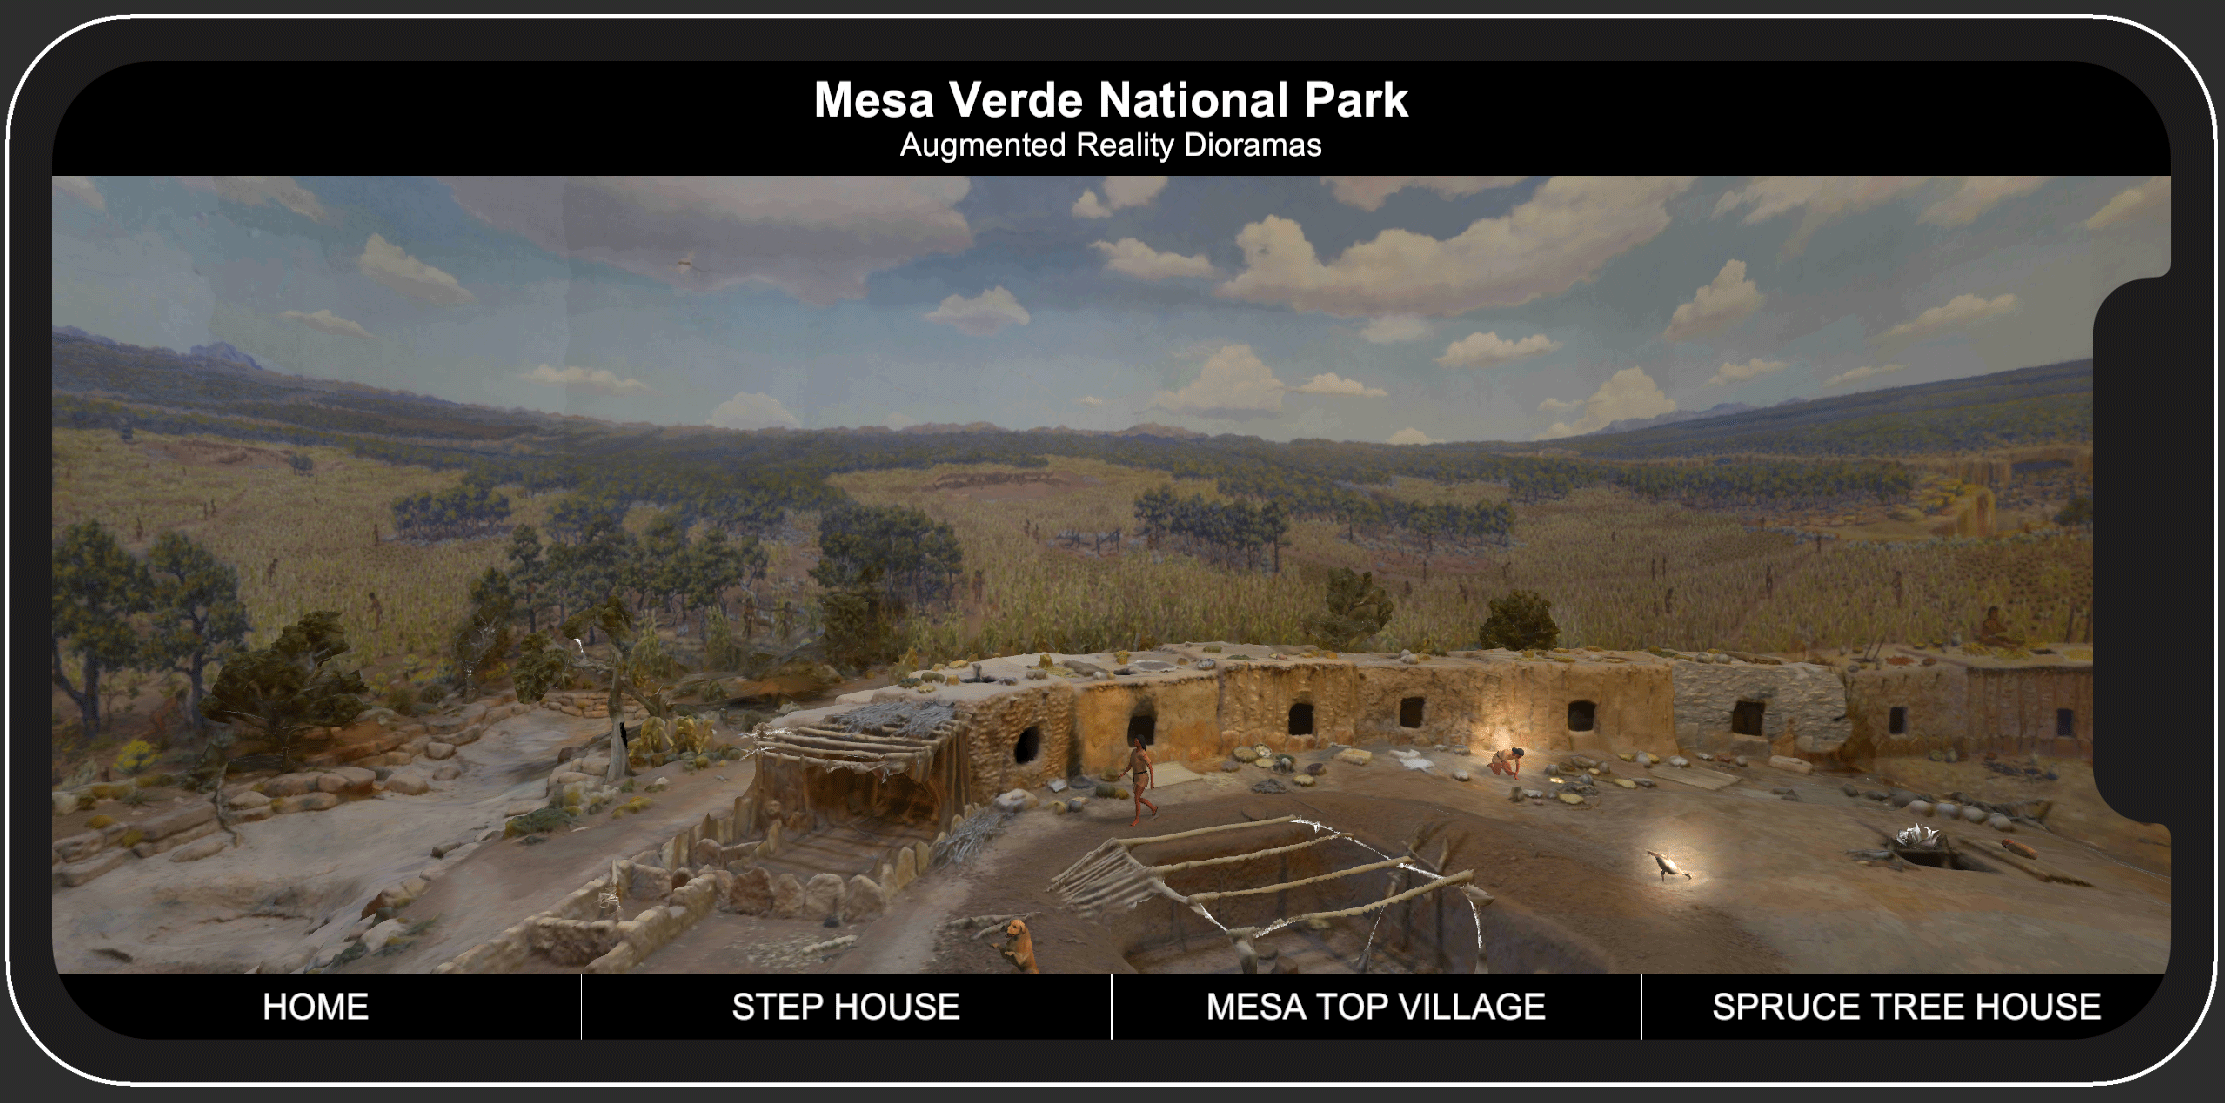
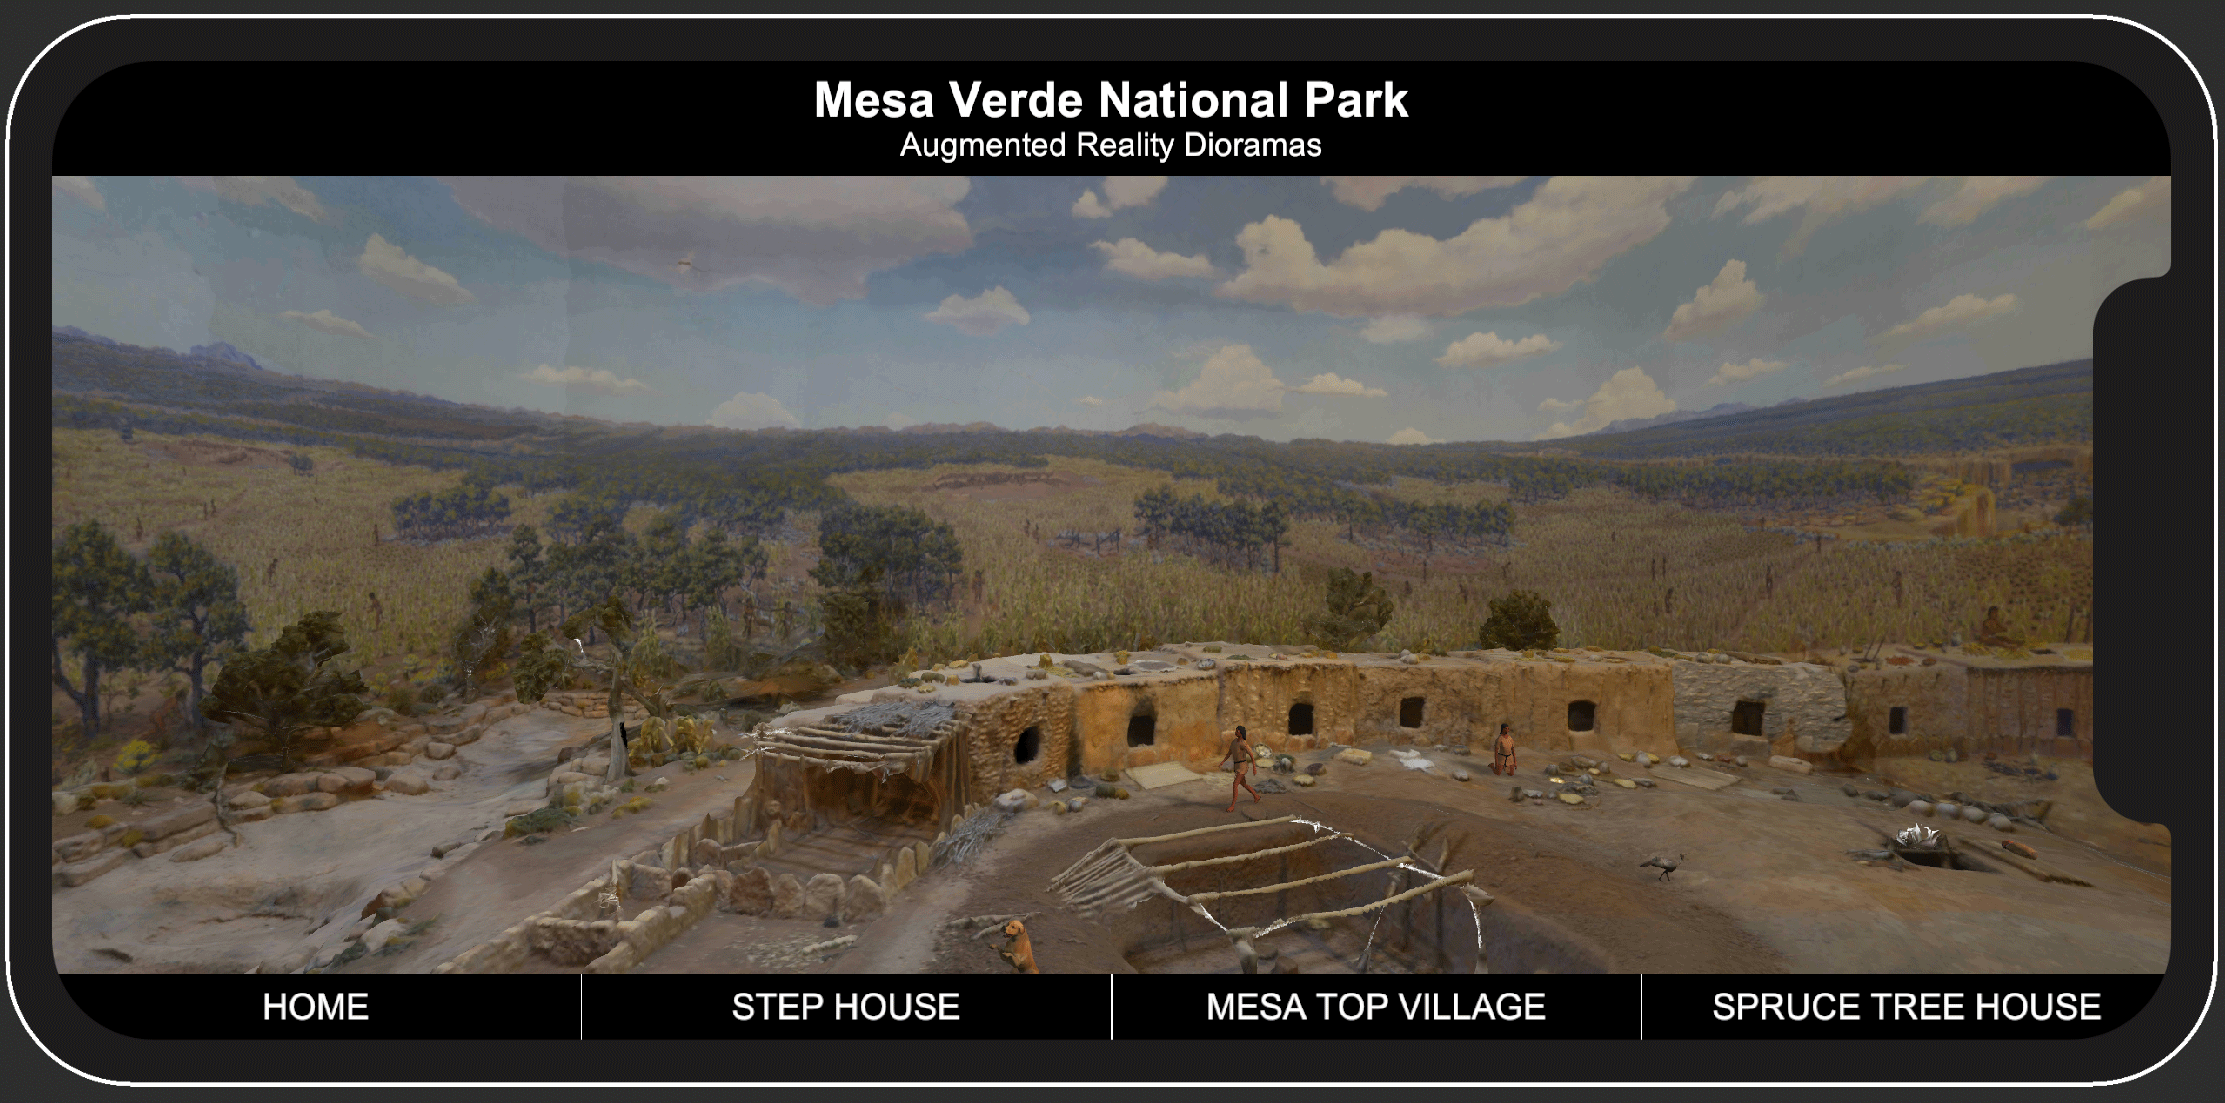
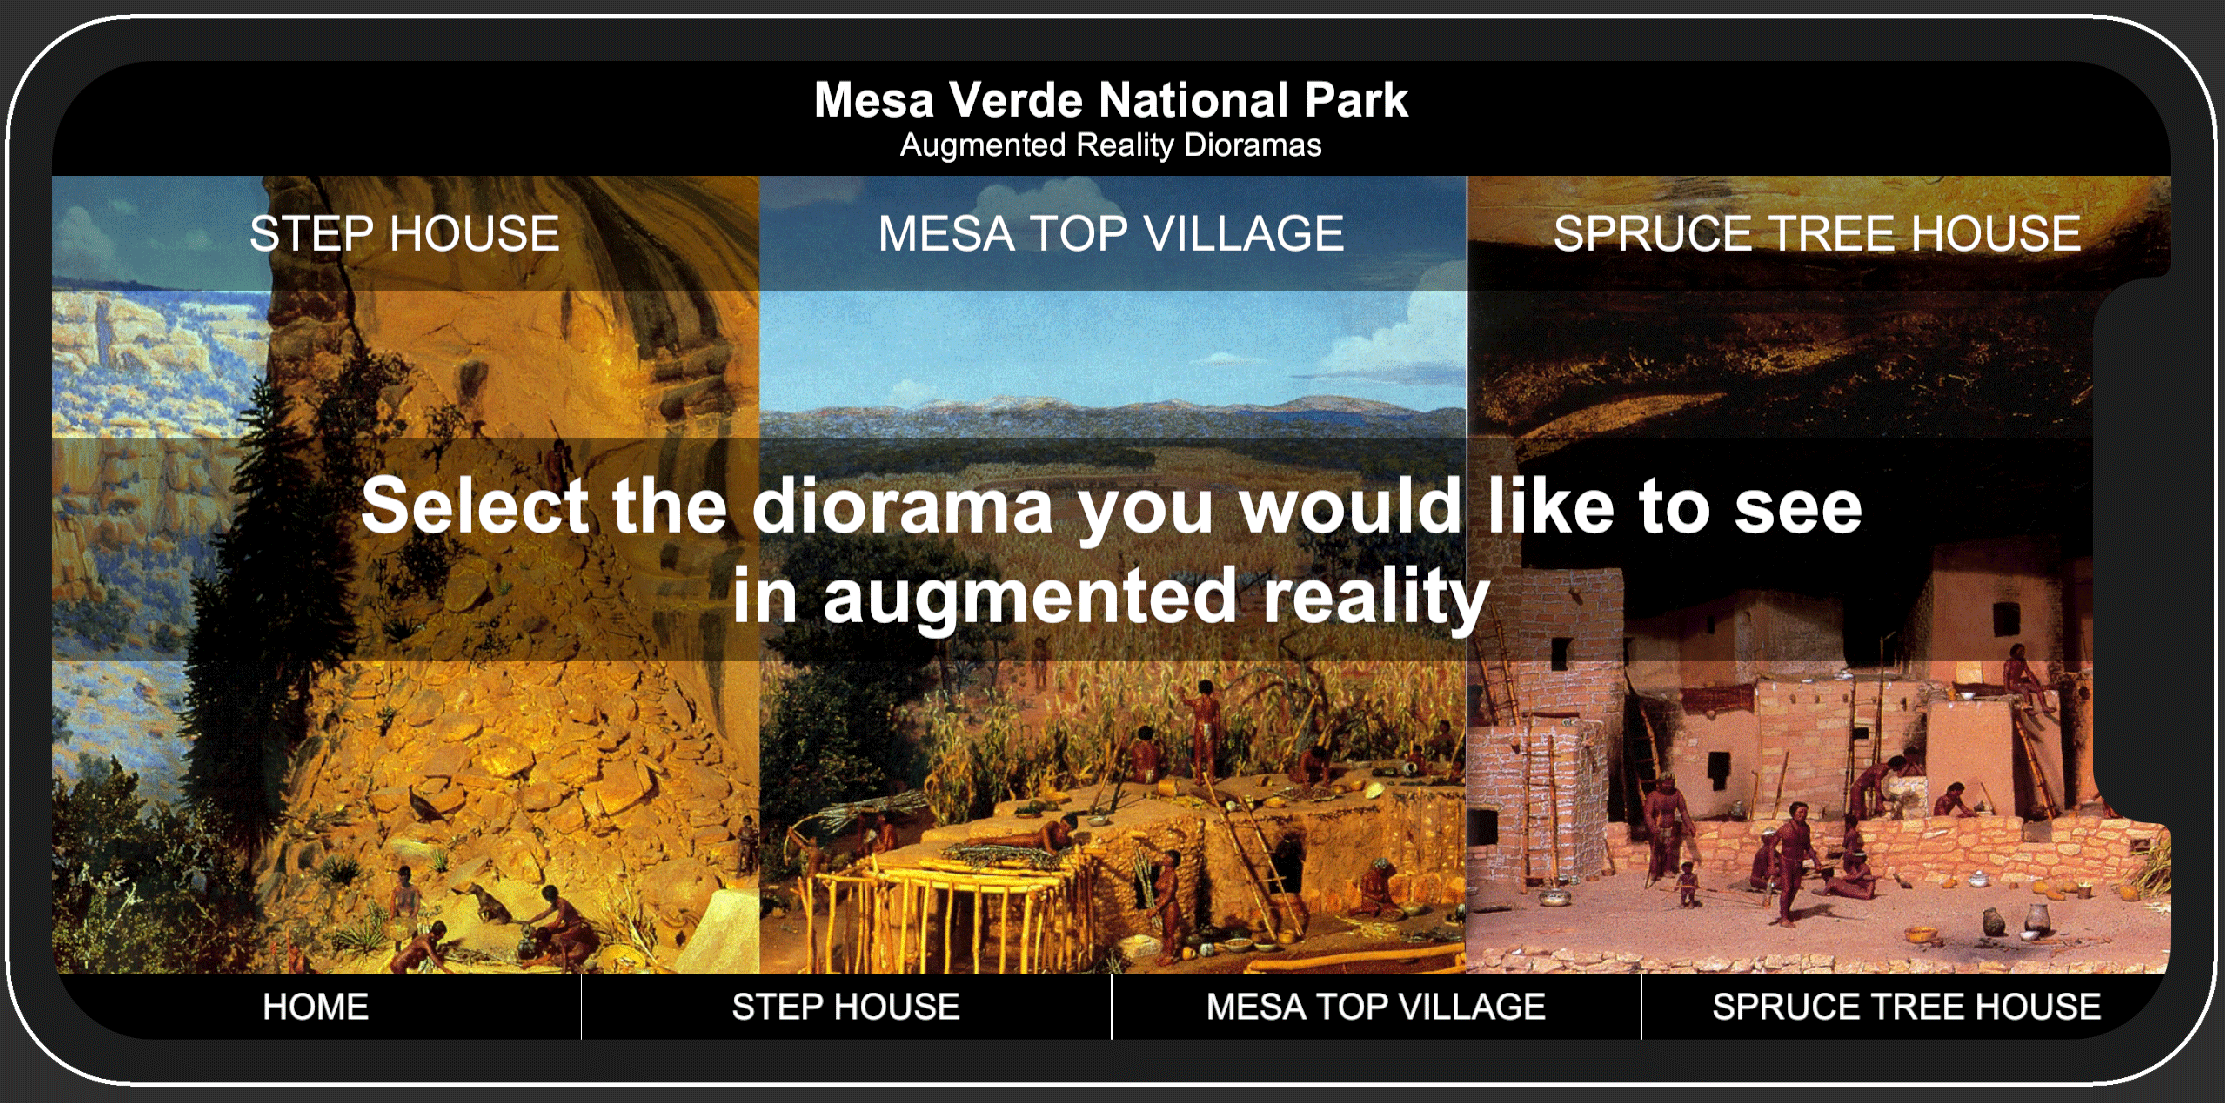
Ball State Univeristy’s IDIA Lab has been contracted by the US Department of the Interior to develop virtual visitor experiences for the Mesa Verde National Park. The park preserves and interprets the archeological heritage of the Ancestral Pueblo people who made it their home for over 700 years, from 600 to 1300 CE. Today, the park protects nearly 5,000 known archeological sites, including 600 cliff dwellings.
The application will bring to life well-known museum dioramas and locative walking tours of the park. Augmented reality and interactive 3D experiences will help tell the stories of the UNESCO World Heritage site – including the transformation of static elements of the historic dioramas with animated figures and interactive elements. The application will be available on both Google Play and AppStore in 2021.
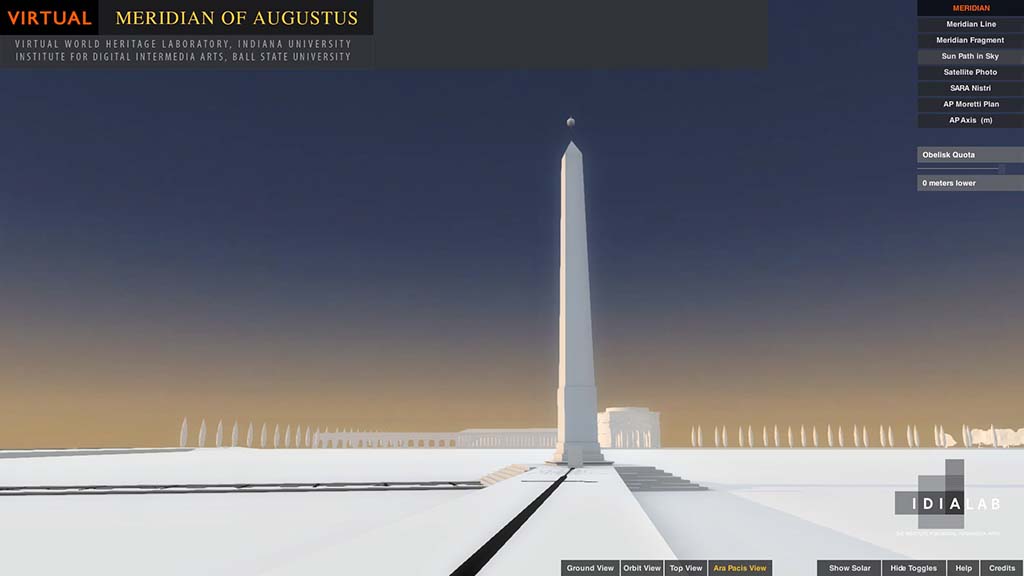
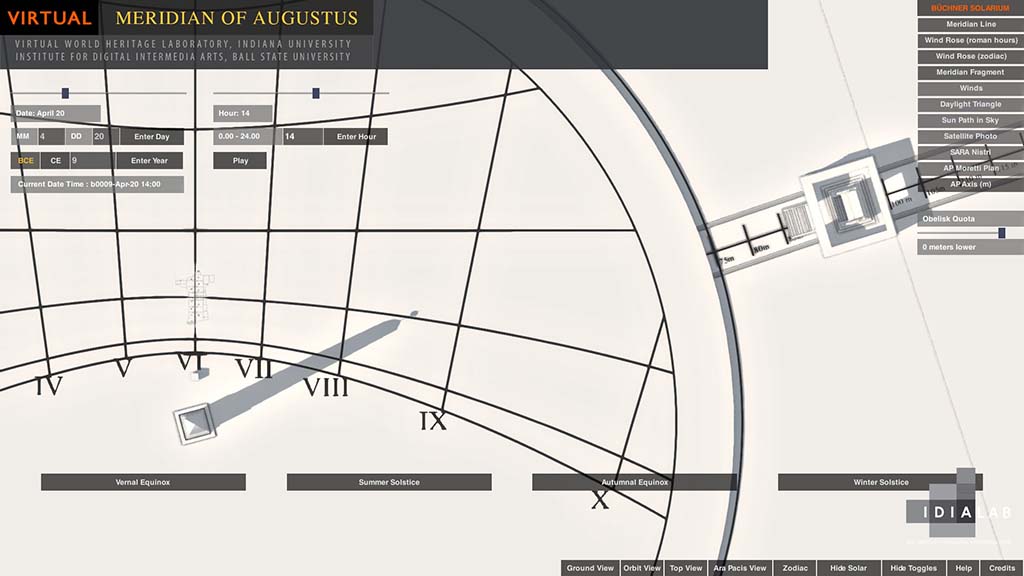
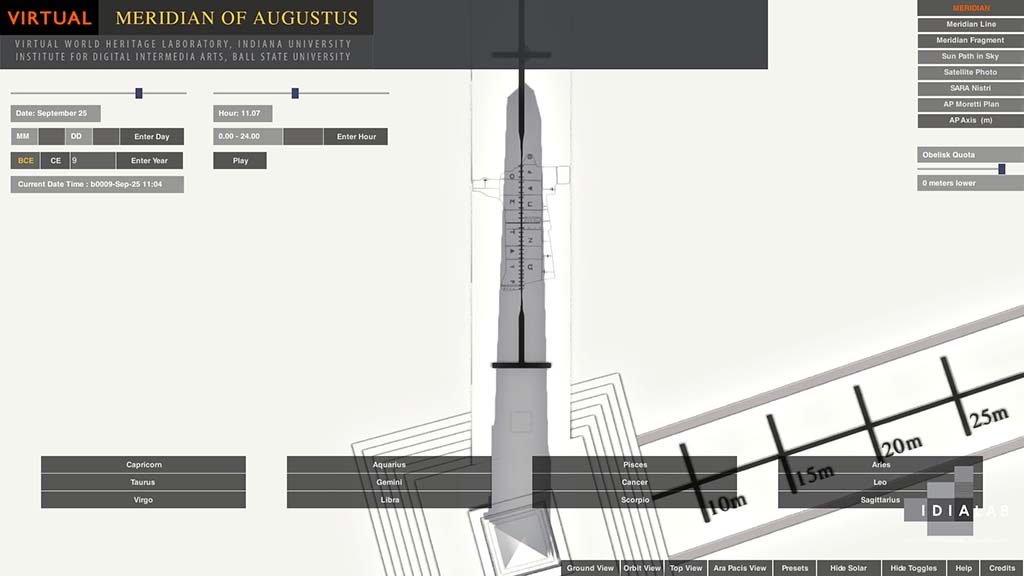
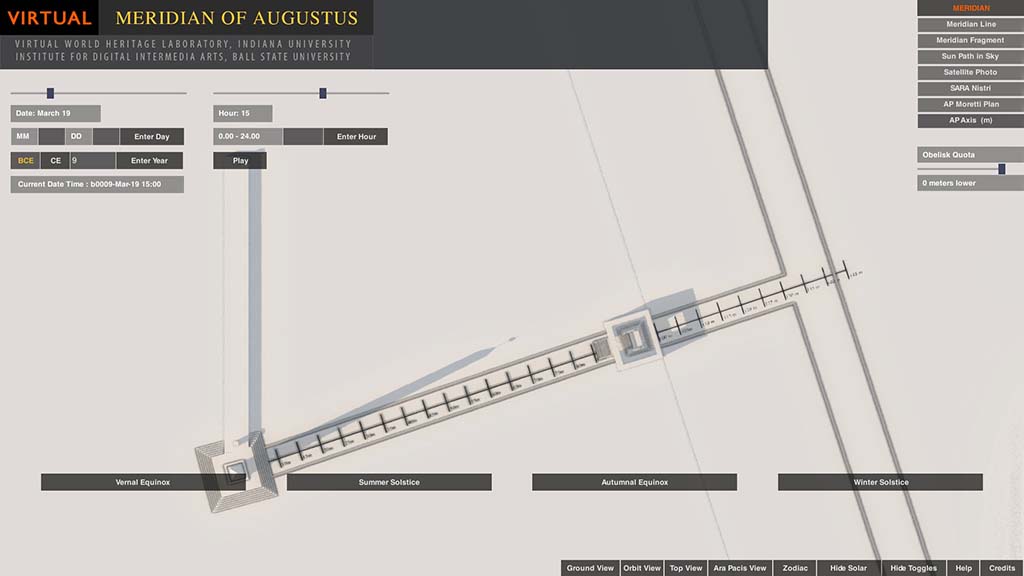
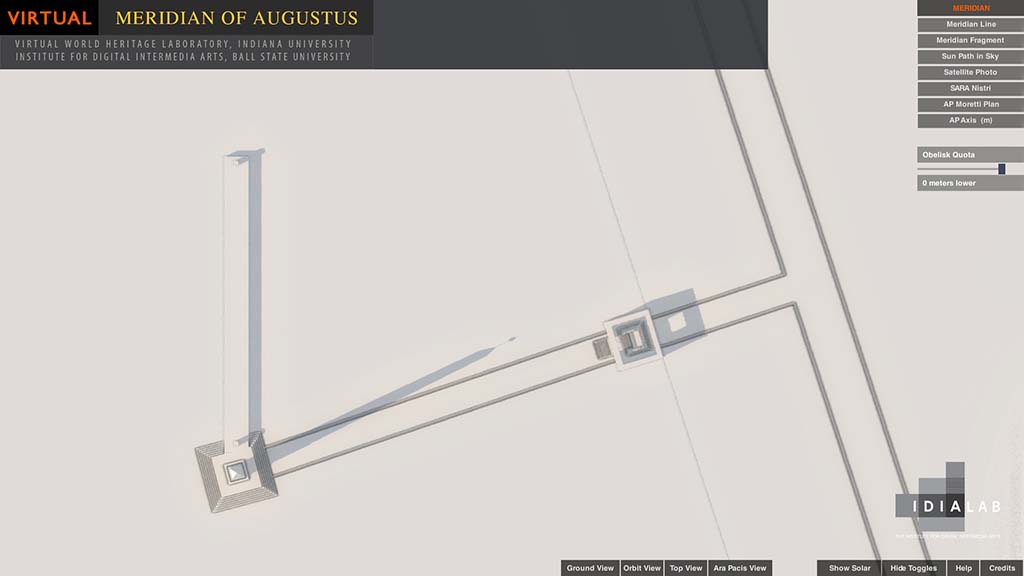
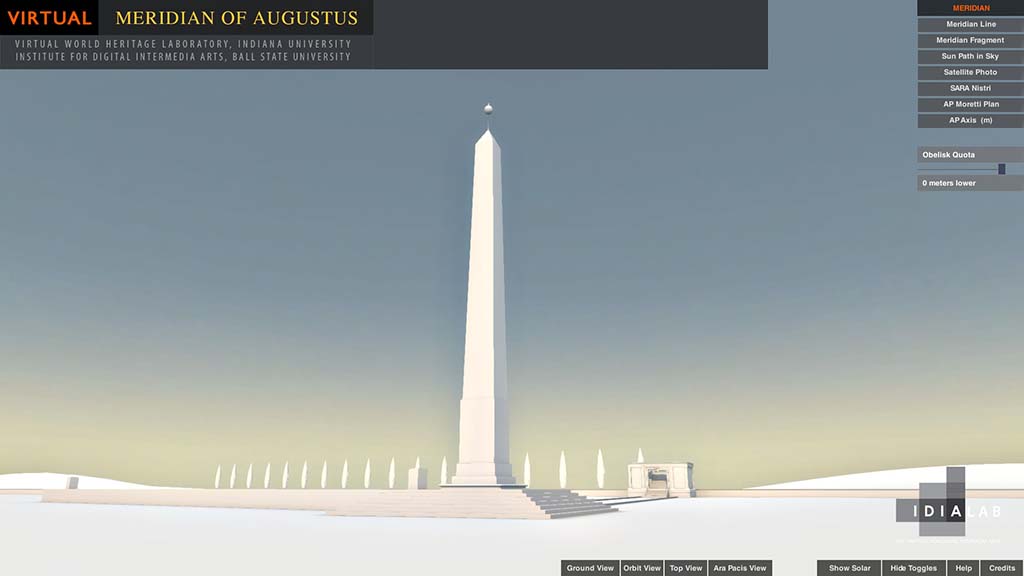
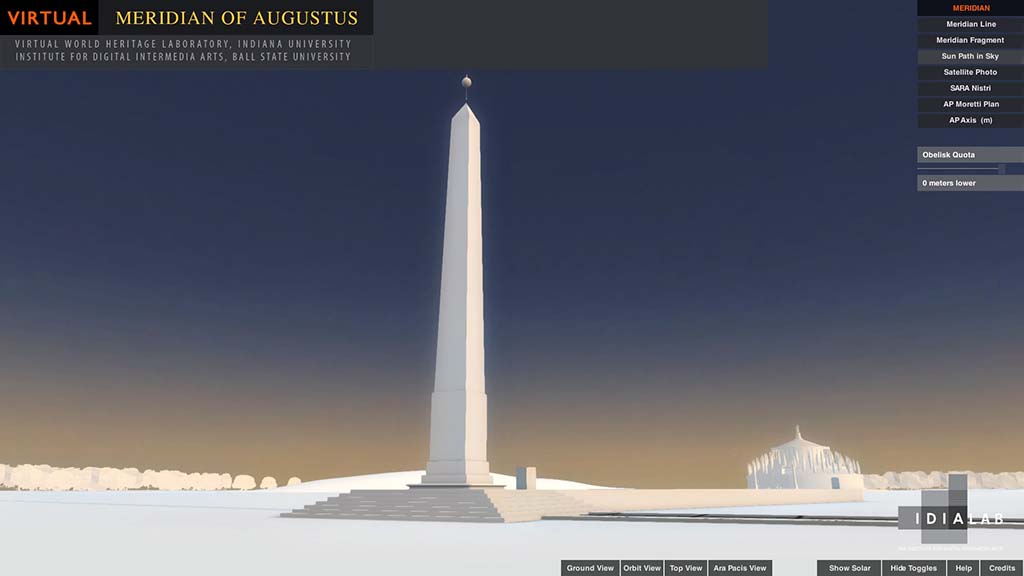
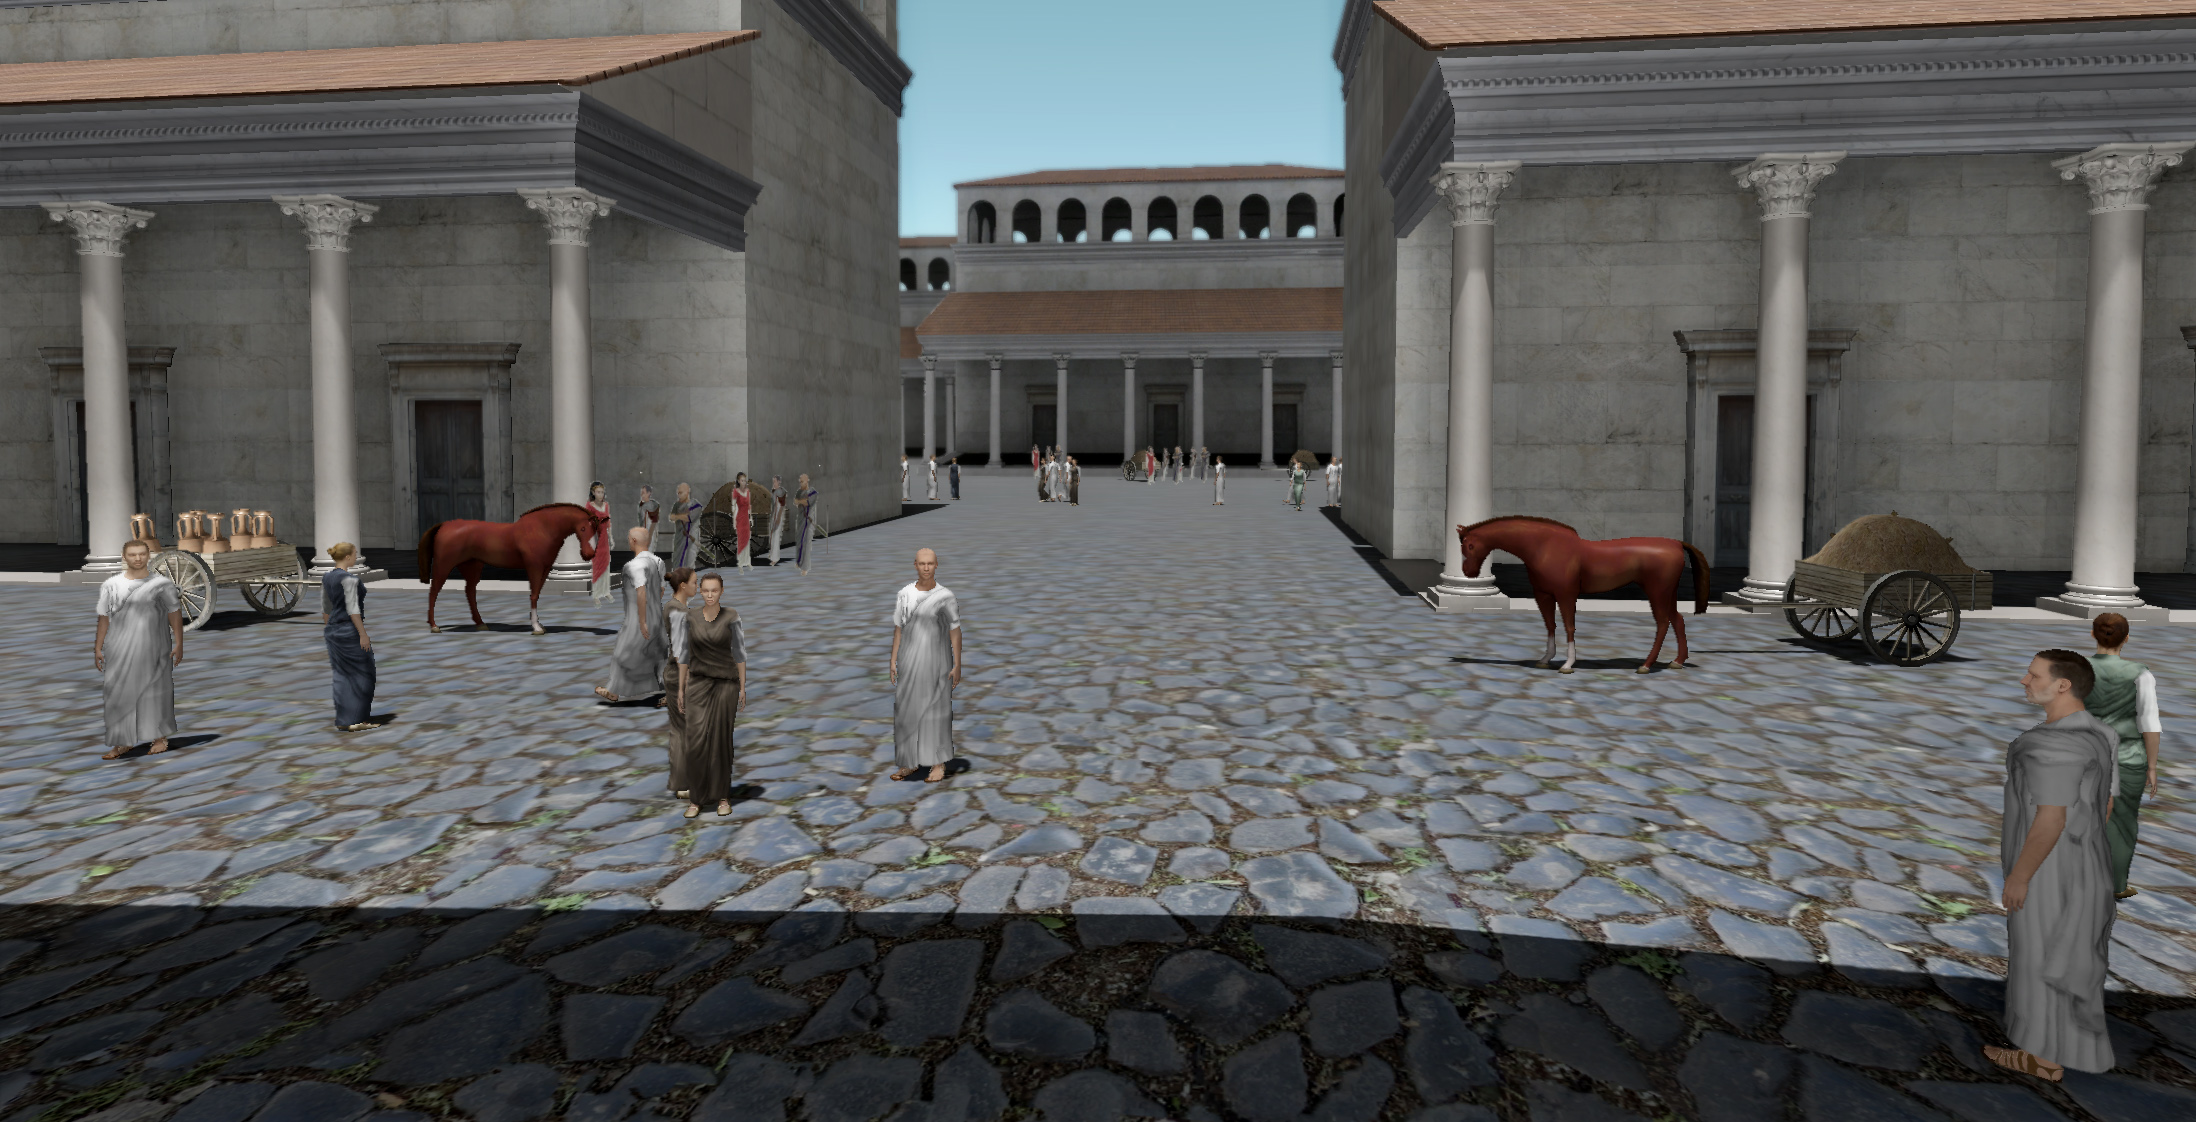
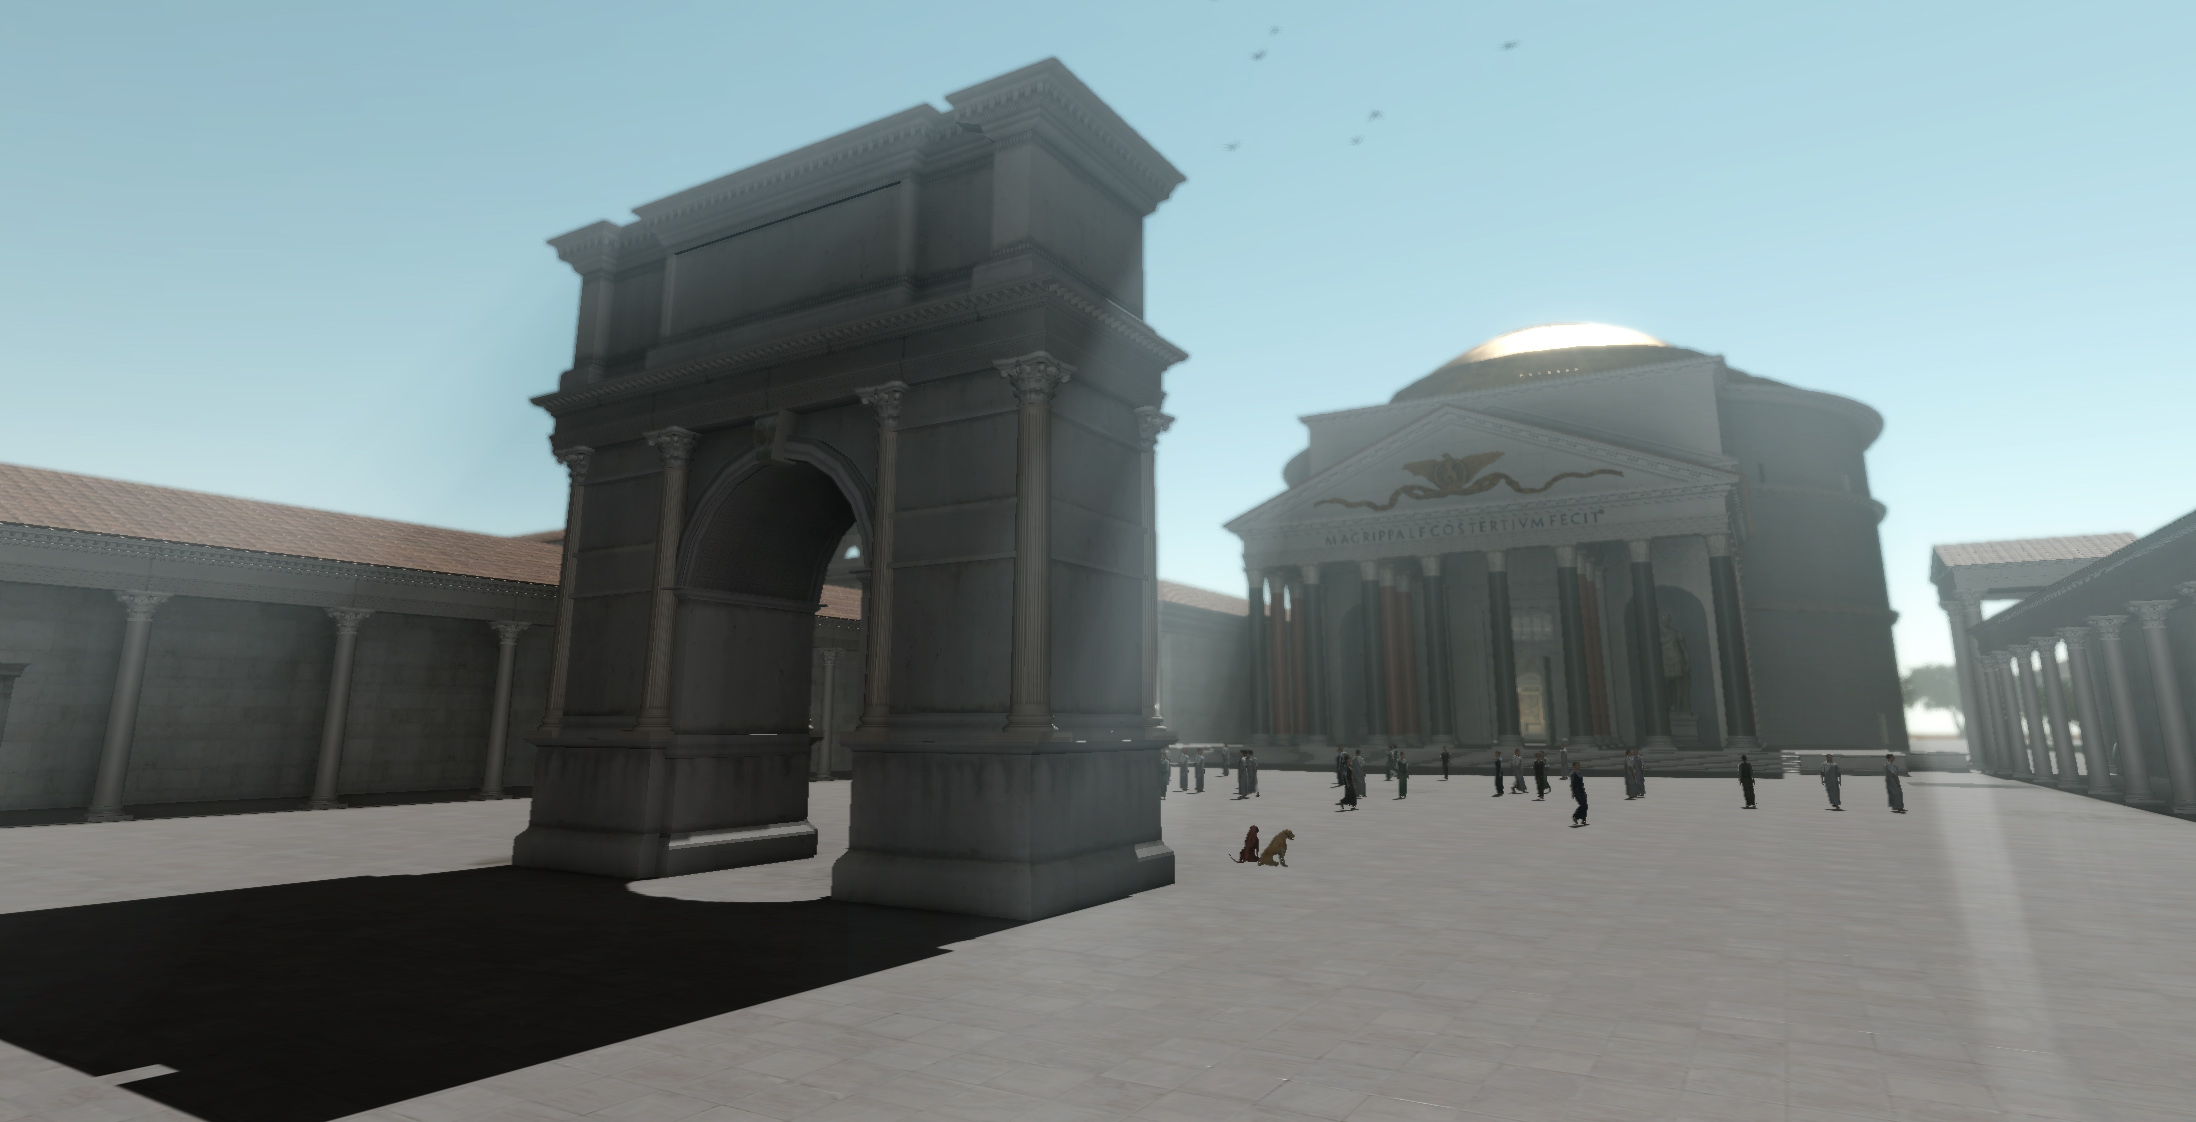
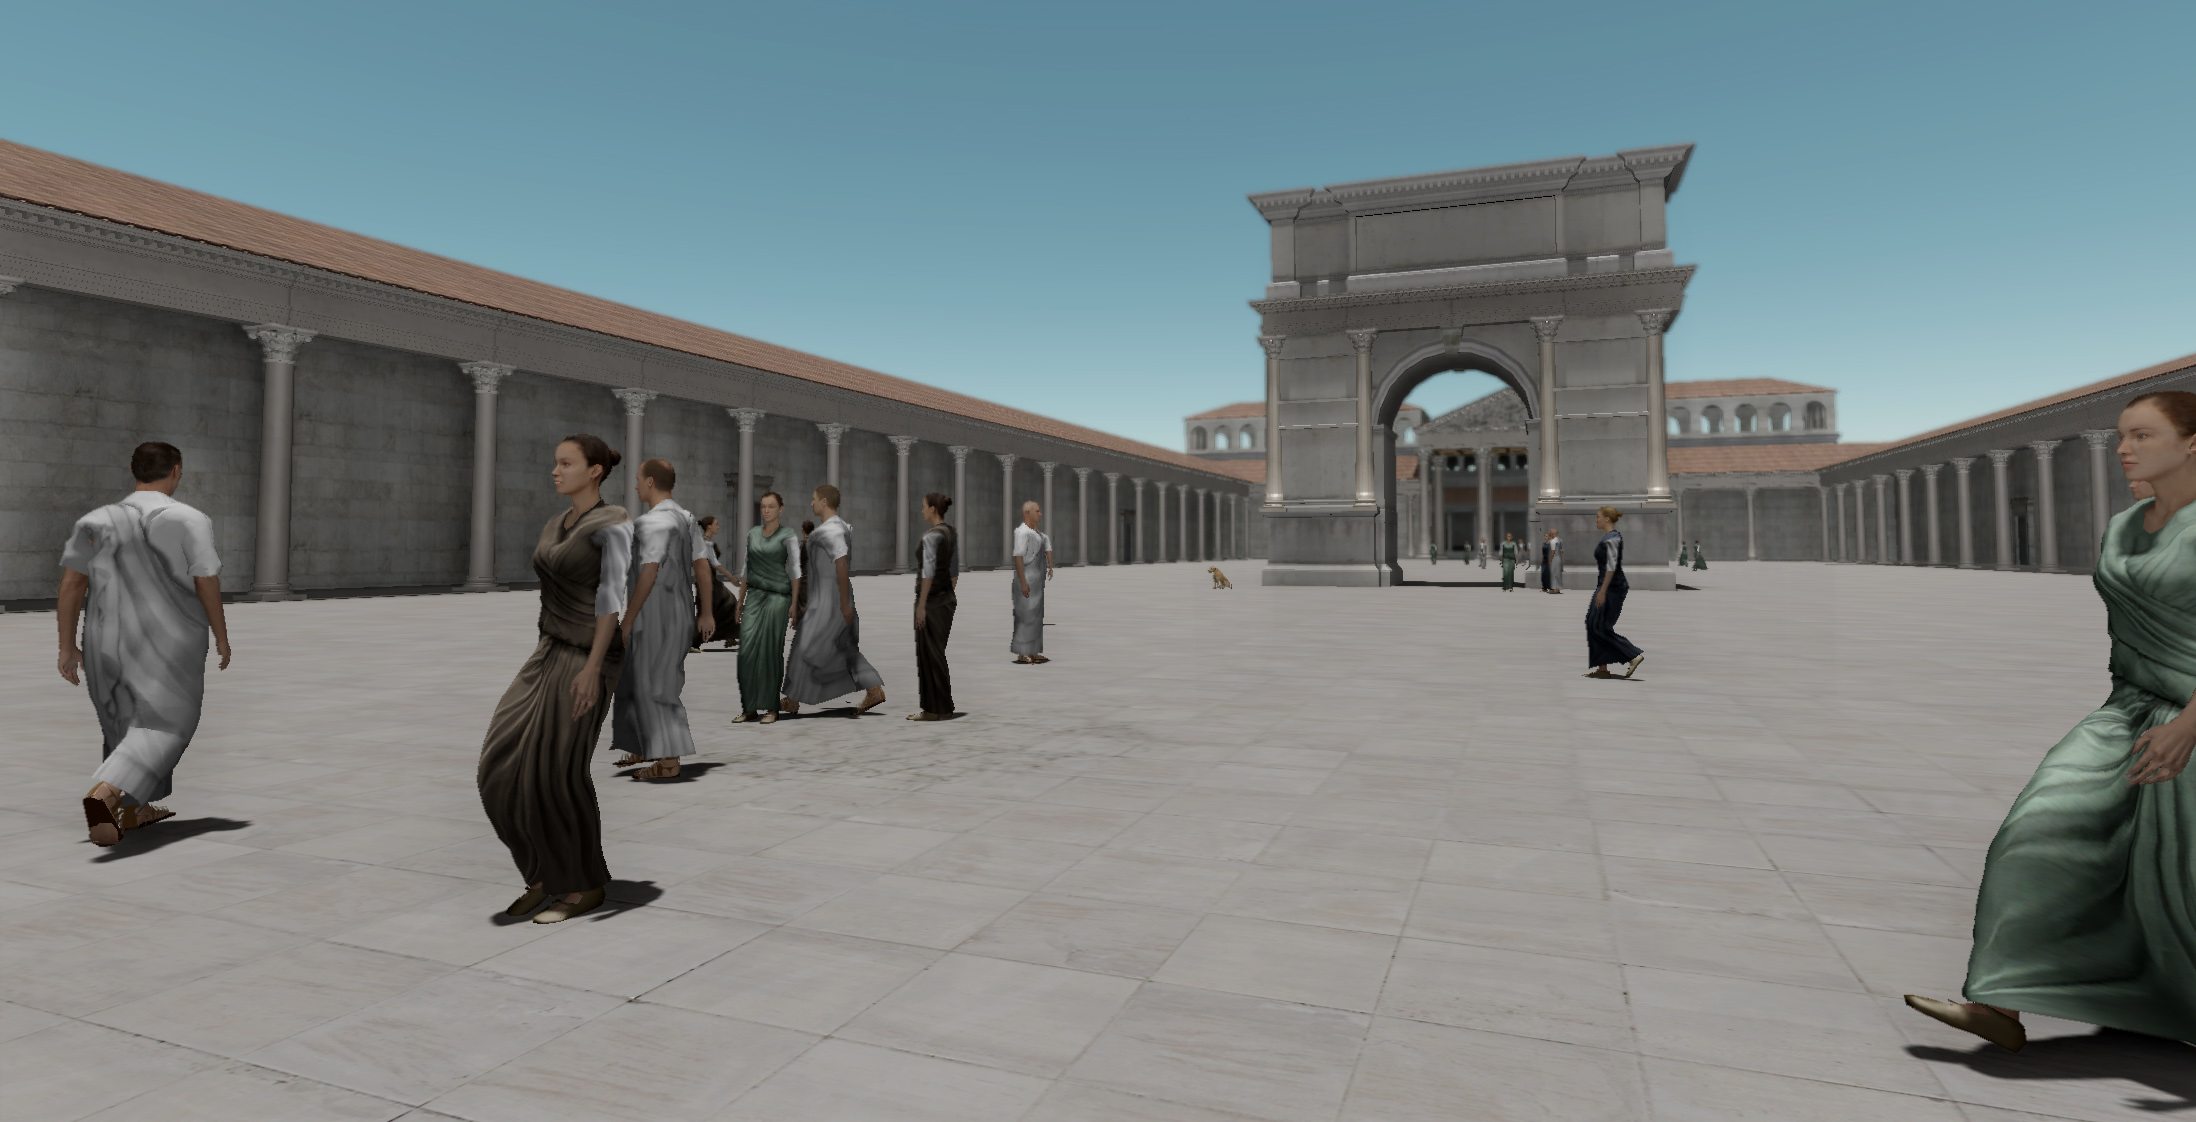
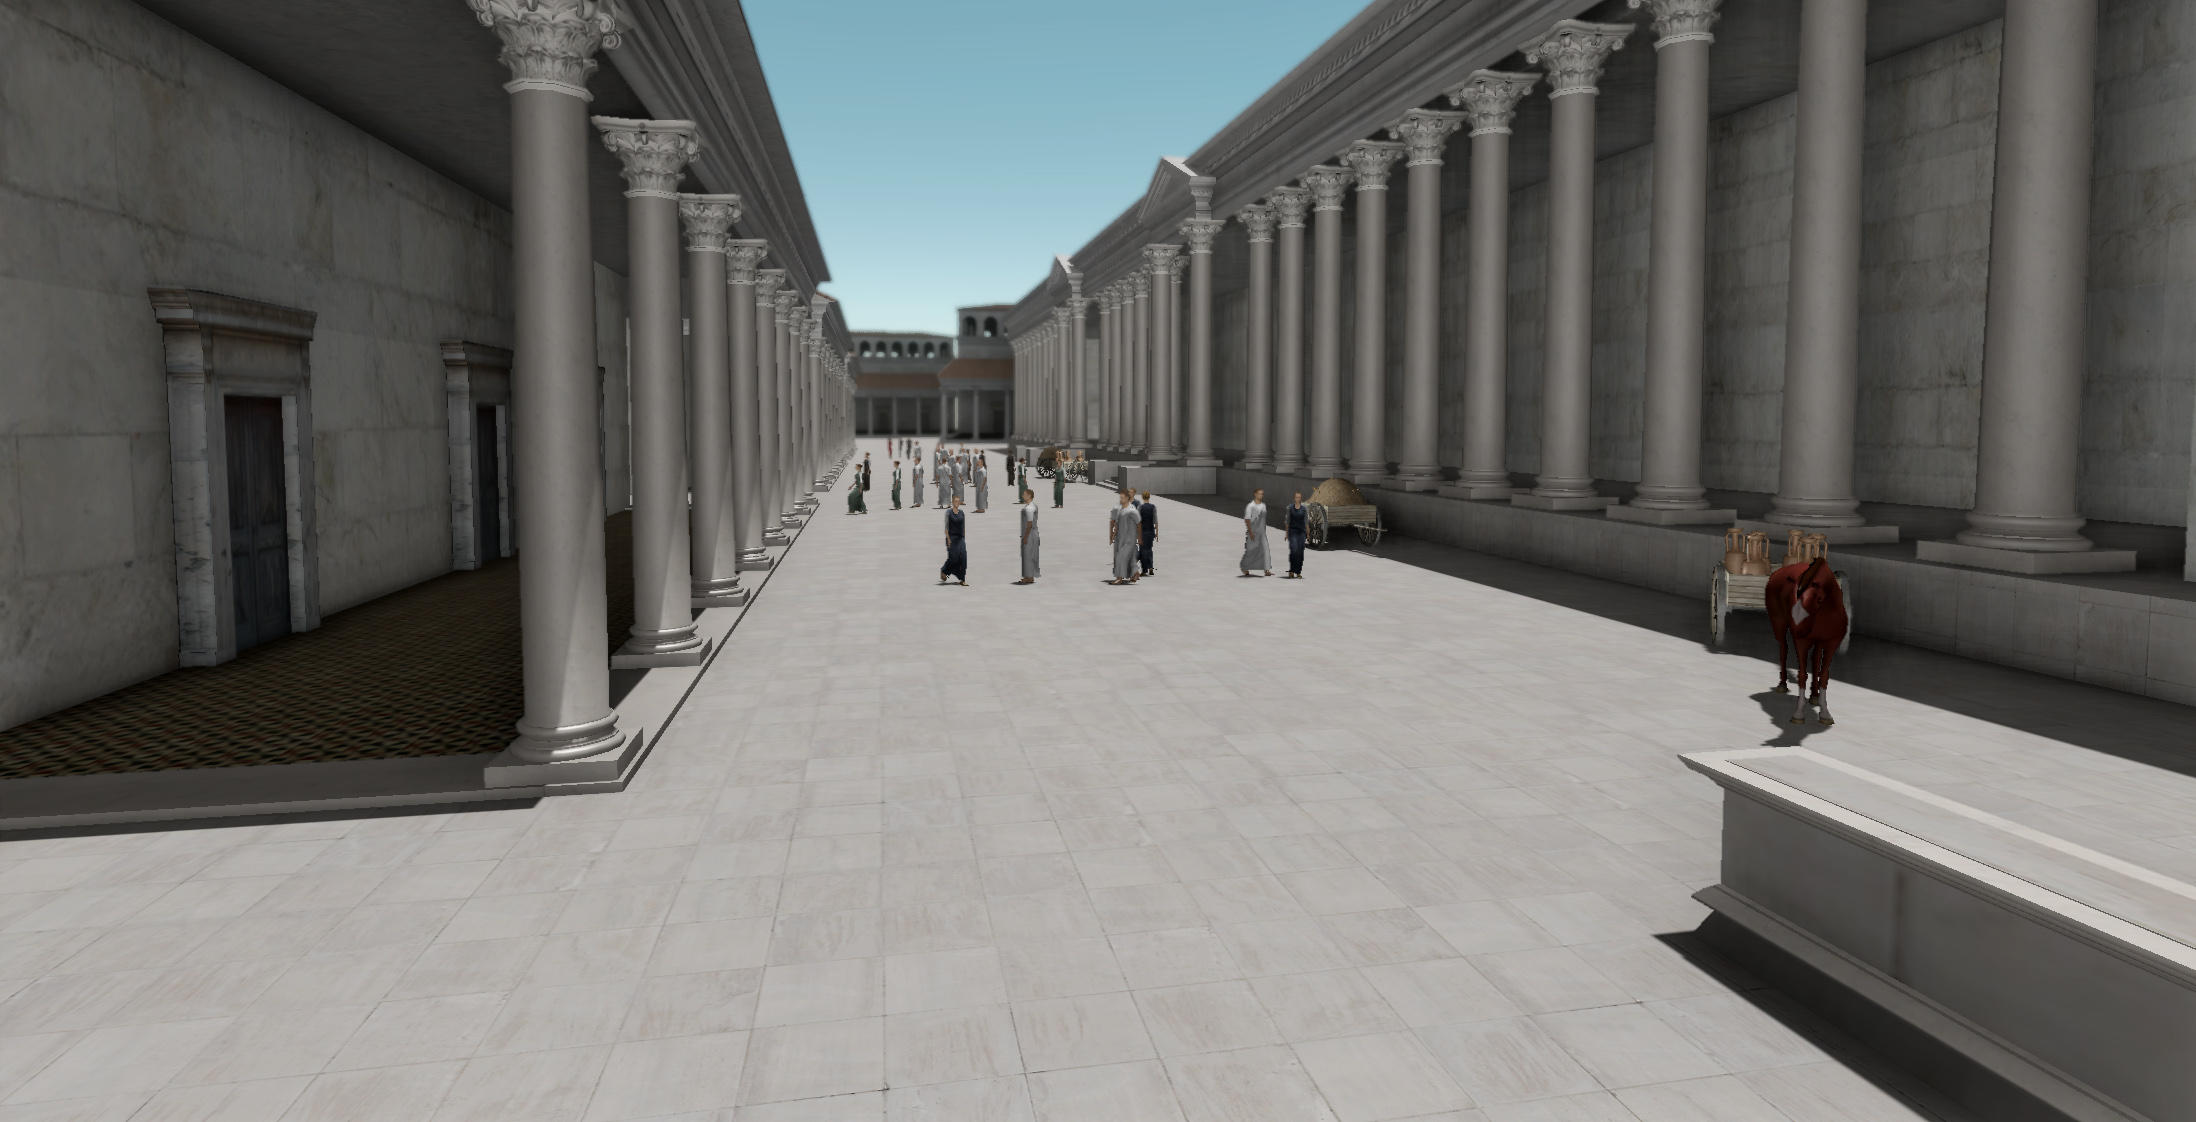
IDIA Lab virtual celestial simulator and 3D interpretation of the Meridian of August in ancient Rome. Project commissioned by the Virtual World Heritage Laboratory at Indiana University, directed by Bernard Frischer.
Findings presented at the Vatican’s Pontifical Academy of Archeology in Rome
Thursday December 19th, 2013
A Digital Simulation of the Northern Campus Martius in the Age of Augustus. Preliminary Results of New Studies of the Relationship of the Obelisk, Meridian, and Ara Pacis of Augustus
by
Bernard Frischer, Department of Informatics, Indiana University
John Fillwalk, Director, Institute for Digital Intermedia Arts, Ball State University
Horology consultant: Paolo Alberi Auber, Italy Archeoastronomy consultant: Prof. Robert Hannah, University of Walkato, New Zealand Archeoastronomy consultant: David Dearborn, Lawrence Livermore National Laboratory, U
SA Data courtesy of NASA Jet Propulsion Laboratory Solar Dynamics Group: Horizons System
A Digital Simulation of the Northern Campus Martius in the Age of Augustus. Preliminary Results of New Studies of the Relationship of the Obelisk, Meridian, and Ara Pacis of Augustus
Bernard Frischer, Department of Informatics, Indiana University
John Fillwalk, Director, Institute for Digital Intermedia Arts, Ball State University
With generous support from the National Science Foundation (grant # IIS-1014956), we have recently been developing a digital simulation of the northern Campus Martius in the period 9 BCE to 40 CE.[1] Our motivation is to create a tool that makes it possible instantly to see the correct positions of the sun and its shadow at any time of day in this period of time so that the various controversies associated with the work of Edmund Buchner on the so-called “Horologium Augusti” can be approached in a new way. We have two main goals in creating the simulation. First, we want to see if Buchner’s and other scholars’ claims and interpretations about the relationship of the Augustan obelisk, the (hypothesized) horologium (which we now call the Meridian of Augustus, following the lead of Albèri Auber 2011-12), and the Ara Pacis can be verified or refuted. Secondly, we want to use the simulation as a support for an empirical survey all over the area of interest to see if it might even be possible, by broadening the field of inquiry in terms of time and space, to arrive at any new insights and discoveries. We are grateful for the opportunity to report on our findings here, and we begin by noting that these are preliminary and can be expected to be revised as our simulation is subjected to further testing and refinement. We concentrate here on the first goal of verification and refutation, reserving a report on the second goal to future publications.
We begin by observing that the use of digital simulations such as ours may still be novel in the field of Roman topography, but they have been used since the early 1950s in physics (Galison 1997:759) and then, increasingly, in other branches of physical and life science to model systems behavior, to speed up difficult computations, and reduce the opportunity for human error. The grounds for and limits of their validity have been usefully treated by Humphreys 2004; and their potential utility in archaeology was mooted by Frischer 2008. As Humphreys stated, “the enormous flexibility and precision of simulation methods provide an opportunity to implement Gedankenexperimente in contexts providing much greater precision than is possible with traditional mental implementations, and they are free from the psychological biases that can effect even simple thought experiments” (Humphreys 2004:115-116).
Of course, precision and valid results always depend on the reliability of the data represented in a simulation. For the all-important apparent size[2] and position of the sun in the sky dome of the simulation, we have relied on NASA’s Horizons System (http://science1.nasa.gov/planetary-science/planetary-science-data/horizons-system/). Among other things, this database takes into account the changes in the sun’s apparent course through the sky that arise from the earth’s wobble as it rotates, providing correct azimuthal information for any point on earth in any historical period, including the Augustan age.
We take as our point of departure the archaeological data and interpretation of the site given by Albèri Auber in this volume and in other publications, especially Albèri Auber 2011-12. We agree with him in the following essential points.
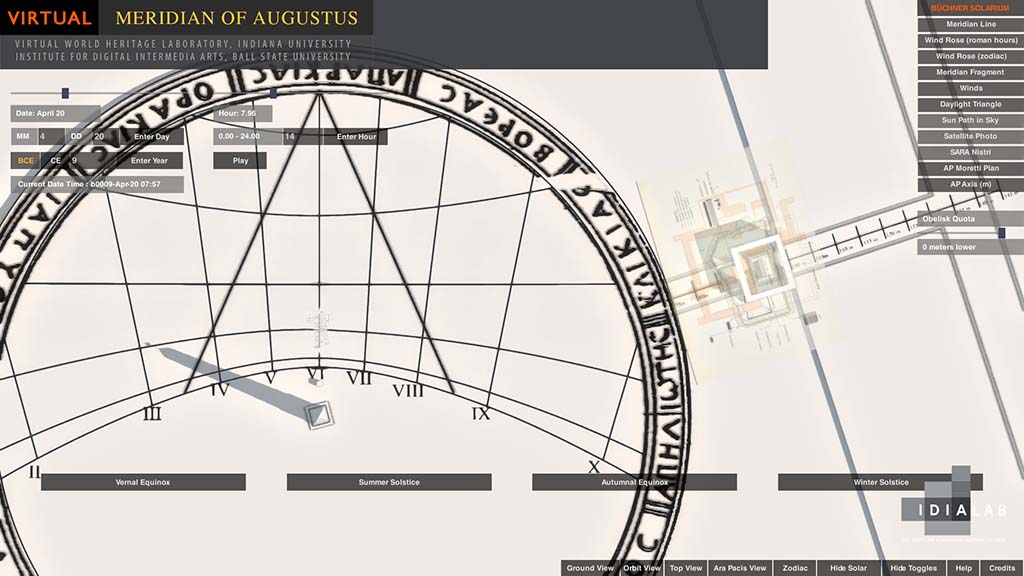
(a) The obelisk was used as the gnomon only for a meridian, not an horologium inscribed on a large pavement, for which no evidence has ever been found. Its purpose was scientific: as Albèri Auber 2012: 484-489 shows, it helped insure that tracking of leap years was correctly done through the observatio umbrarum (Pliny NH 2.35)
(b) There is only one phase for the obelisk-meridian: the Augustan phase. Buchner’s Flavian phase is a phantom based first on his reliance on Guarducci’s dating of the letters of the inscriptions found at 48 via Campo di Marzio to the first century CE (Buchner 1980: 362), a dating later withdrawn without comment (Buchner 1983: 505); and then on the brief report in Rakob 1987: 693- 94 that La Torre dated the ceramic fragments found in Buchner’s excavation to the Flavian period. However, La Torre has never published the pottery, nor did Rakob ever publish the stratigraphy, quota levels, and a plan showing the exact find spots. Until this evidence is produced and interpreted, we must suspend judgment. Our consultant on Greek epigraphy, Mika Kajava, will be writing a report on the dating of the lettering. Here we may quote his personal communication of August 1, 2013: “Considering the meridian inscriptions, in my view, it would be difficult to suggest a precise dating on the basis of paleography: an Augustan monumental text set up in a public place could look very similar to a Claudian or even a Flavian one. This is also because monumental writing tends to be conservative, and occasionally it is even archaizing. In the present case, one may also wonder if the fact that the texts were presumably modelled upon Greek precedents had some (extra) influence on the letter style.”
(c) The sub-phases of the project are: (i) the idea to bring an Egyptian obelisk to Rome as a manubial donation: presumably in 30 BCE after Augustus’ victory over at Alexandria and his annexation of Egypt; (ii) the vow of the Ara Pacis on July 4, 13 BCE; (iii) the dedication of the obelisk in 10 BCE,[3] presumably in conjunction with the twentieth anniversary of the victory at Alexandria;[4] (iv) the dedication of the Ara Pacis on January 30, 9 BCE; (v) the addition of the meridian at an indeterminate date during the reign of Augustus.[5]
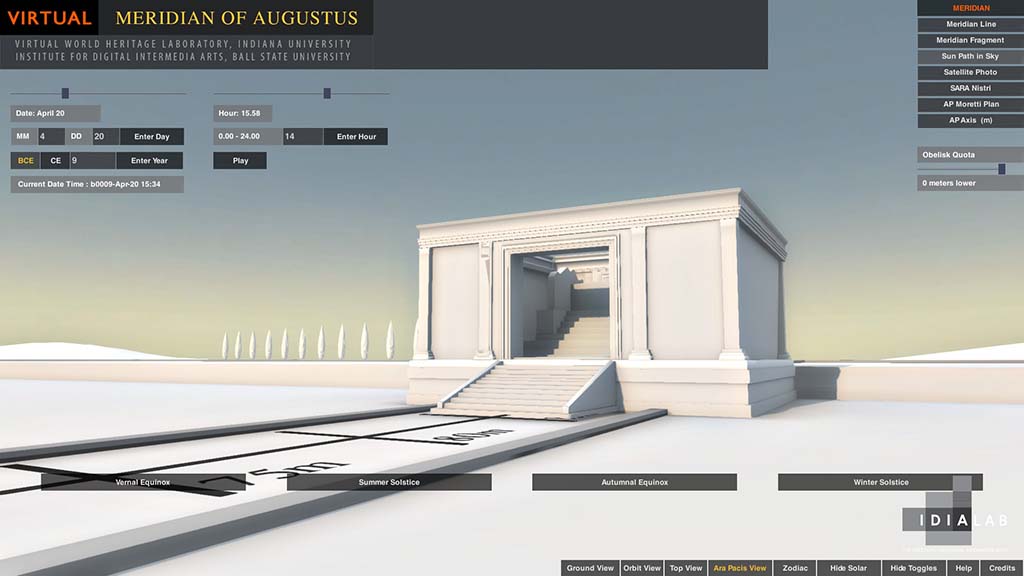
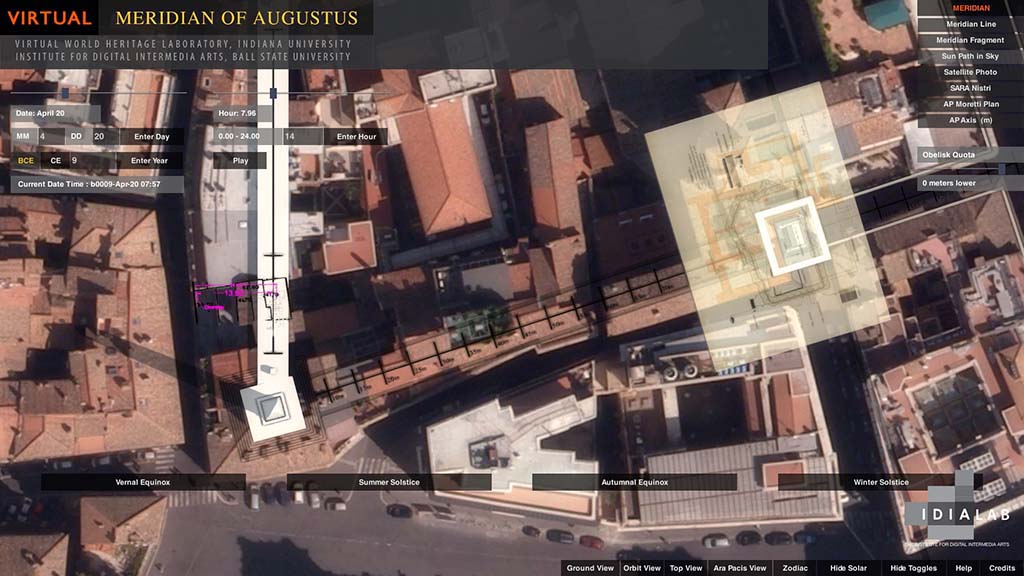
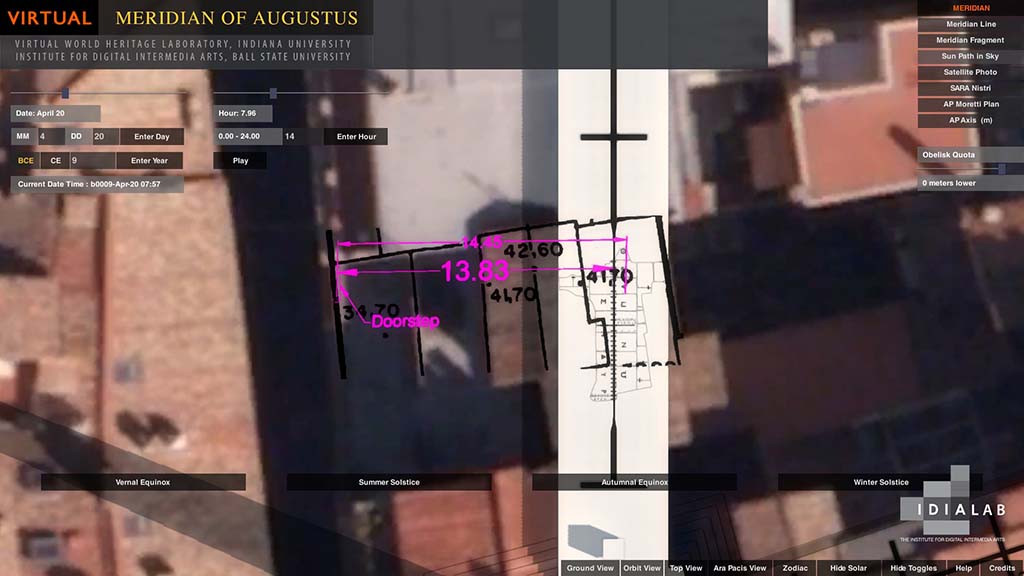
(d) The height of the obelisk (including plinth, the bar between the pyramidion and the sphere, and the sphere itself) was 100 Roman feet. Haselberger (personal communication, October, 2013) stresses that this dimension is based on evidence that permits a range of possible heights varying by 3 to 6 feet depending on such factors as how we convert the Roman foot to meters, the unknown dimensions of the distanziatori (in the unlikely event such actually existed[6]), the height of the pole attaching the sphere to the pyramidion, and the diameter of the sphere itself. Albèri Auber takes a different tack: as a practicing gnomonologist himself, he stresses the practical advantages to his ancient Roman counterpart of working with the round number of 100 Roman feet and the useless complications that result if the height differed fractionally from it. Alberi Auber thinks that if 100 Roman feet is within Haselberger’s possible range of heights (and it is), and if the alternatives force us to work with dimensions such as (to make up some random examples) 101.33 or 103.75 Roman feet which would greatly complicate the ancient gnomonologist’s calculations of the length and subdivision into 360 degrees of the meridian, then, faute de mieux, 100 Roman feet is the obvious solution.[7] We agree. In a forthcoming publication, we give the GPS coordinates, dimensions, and bibliographical sources for our 3D models of the meridian, obelisk, and Ara Pacis (Frischer and Fillwalk 2013). In brief, we claim +/- 2 meter accuracy for the placement of the existing fragment of the meridian at via di Campo Marzio 48 and of the Ara Pacis. The position of the obelisk at piazza del Parlamento 3 was derived from its height and the shadow it cast in relation to the position of meridian fragment, as previous scholars have noted can be done (e.g., Heslin 2007:13). In the same publication, we also describe the technical specifications of the simulation. In brief, we authored the model in Maya and converted the 3D model of the northern Campus to the game engine Unity. We developed a plug-in which, as noted, utilizes azimuthal data from NASA’s Horizons System. In calculating where to position the sun and create a lighting solution for observations concerning the obelisk and its shadow, we used the geocoordinates of the obelisk; for those concerning the Ara Pacis, we used the geocoordinates of the Ara Pacis. Unity makes it possible to roam around the simulated landscape and to see the monuments from both freely chosen and preset points of view. For example when the “Ara Pacis View” is selected, movement is restricted to the hypothetical axial line from the center of the base of the obelisk to the Ara Pacis and beyond to the via Flaminia. The height of the camera is fixed at 1.58 m, the average height of the human eyes. In this way, in Ara Pacis View, it is not possible to deviate from a true axial position, and the sun (or its shadow) appears in a way that would have been visible to the ancient adult Roman.
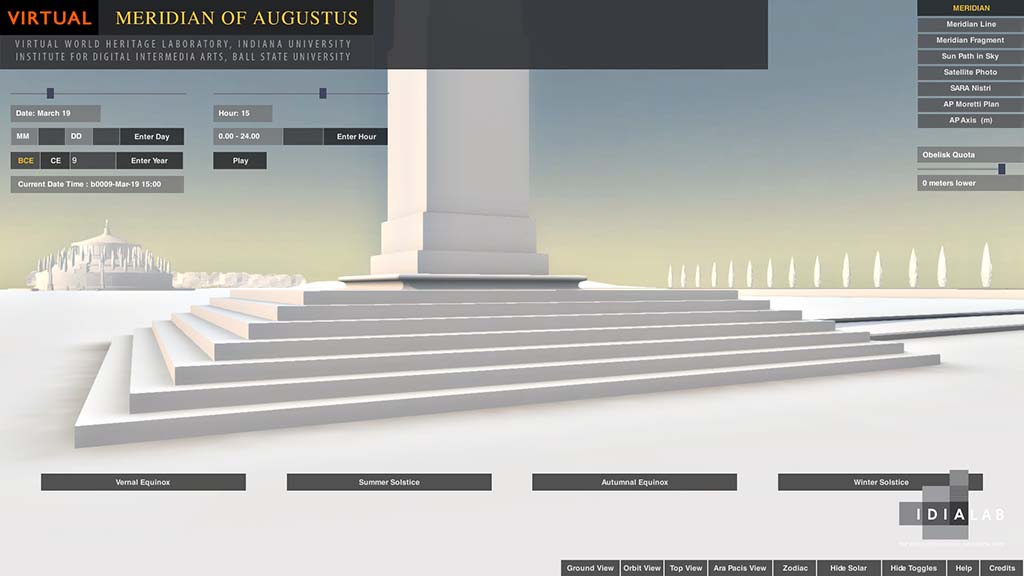
Everything stated in section 3 explains the default settings for our simulation. But we have made an effort to build a certain flexibility into the simulation so that it can support different interpretations of the archaeological situation. Thus, even though the default setting does not display Buchner’s hypothesized pavement and horologium, we have included a software switch that can be thrown to illustrate where Buchner thinks this would have been positioned. Similarly, we have a slider that can lower the height of the obelisk in units of 1 mm to a depth of 2 meters. Pending additional funding, we plan to make all major components of the simulation equally flexible, so that, for example, one can also raise the obelisk up to 2 meters higher in increments of 1 mm; and one can move the center of the Ara Pacis in any direction by 2 meters in the same increments. In this way, we hope to create a flexible tool that supports assumption-free scientific research, allows adjustments to be made to improve accuracy, and is not limited to one particular reading of the archaeological record. In our view, the simulation ought ideally to serve the needs of archaeologists without itself becoming a new topic of debate.
On the basis of the default values, we have thus far addressed the following issues that bulked large in the articles published in JRA 2011: (1) Did the shadow of the obelisk travel all the way down the equinoctial line (whether real and inscribed, or purely hypothetical) to the center of the western façade of the Ara Pacis on September 23, Augustus’ birthday? (2) If the shadow hits the façade of the Ara Pacis, does it have salience? (3) Did the shadow of the obelisk point toward the Ara Pacis at some point every day of the year? (4) Is the Ara Pacis oriented, not toward the obelisk, but toward the rising sun on April 21 (Parilia)?
Before answering the first question, we note that our formulation of it reflects the “strong” reading of Buchner’s thesis about the relationship between the obelisk and Ara Pacis.[8] Like several scholars before him, Haselberger 2011:64 interpreted Buchner to mean only that the shadow progressed along the line, implicitly pointing toward the center of the western façade of the Ara Pacis, but did not necessarily reach the façade.[9] We call this the “weak” interpretation of Buchner. Our simulation can address both interpretations. Here we note that we dispute the weak interpretation and think Buchner did indicate that the shadow hit the façade. Even if Buchner never states this expressis verbis—just as he never says expressis verbis what scholars holding to the weak interpretation think that he says–what Buchner did write, taken in relation to his illustrations, leaves little doubt about what he meant. Buchner 1976: 347 does state, as Haselbeger relates, “am Geburtstag des Kaisers…wandert der Schatten von Morgen bis Abend etwa 150 m weit die schnur-gerade Aequinoktienline entlang genau zur Mitte der Ara Pacis….” The weak interpretation of these words is that Buchner knew that the shadow moved along the equinoctial line but did not reach the facade of the Ara Pacis; and therefore that Buchner’s phrase, “etwa 150 m,” referred simply to the inscribed equinoctial line on the (hypothesized) pavement of his horologium. Our view is that the scholars who think Buchner meant that the shadow hit the façade of the Ara Pacis are right because of the phrase “etwa 150 m.” What does this refer to? If one measures the equinoctial line of the horologium on Buchner’s figure 7 (p. 337), one finds[10] that 1 cm=20 m. One also finds that the length of the equinoctial line on the horologium (i.e., the solid line) is 7 cm=140 m. But Buchner said “etwa 150 m.” If one then measures his dotted line extending the solid equinoctial line to the middle of the facade of the Ara Pacis, one discovers the missing 10 m. For the weak interpretation to be right, Buchner would have to have written “etwa 140 m.” Moreover, advocates of the weak interpretation must also explain why Buchner accounts at p. 346 for a supposed architectural anomaly of the two entrances of the Ara Pacis by claiming that “die Aequinoktienlinie des Solarium geht durch die Ara hindurch, durchschneidet wie di Vorder- so auch die Rückfront….” And this, too, is clearly seen in his fig. 7 on p. 337. This latter point is, it seems to us, decisive evidence in favor of the strong interpretation. Buchner cannot simply mean that an imaginary equinoctial line can be extended from the end of the actual inscribed line through the west to the east entrance of the Ara Pacis. Such an imagined extension of a line would not require a physical entrance and exit point. Buchner must, rather, be loosely describing an actual physical event, namely the progress of the shadow along the (imagined) extension of the equinoctial line through the altar. Clearly it is the shadow that requires the two entrances, not the hypothetically extended line. At any rate, since the weak interpretation is often encountered in the scholarly literature,[11] we address it here as well as the strong interpretation.
To answer the first question as understood by the strong interpretation, the simulation suggests that it is true, as Buchner always claimed, that on September 23 the shadow of the obelisk progresses more or less down the (in our view hypothetical) equinoctial line in the zone that would be paved and inscribed with the horologium Buchner imagines. Since September 23 is not the actual date of the fall equinox in the Augustan age (which fell on the 25th of the month on the Julian calendar), the shadow actually fails to hit the line at the beginning of the second hour of the day; but for most of the second hour and all the other hours indicated on Buchner’s diagram of the horologium, the shadow does move along the line. However, the simulation also shows that, just at the crucial moment, when the shadow leaves that zone and approaches to ca. five meters of the center of the façade of the Ara Pacis, it veers off course (see figure 1).These are the facts, at least if the simulation is reliable. In our view the simulation refutes the strong interpretation of Buchner and also casts doubt on the validity of the weak interpretation. If, as Buchner thought, the whole point of the ensemble Obelisk-Ara Pacis is an alignment of the latter with the former precisely on Augustus’ birthday, then the fact that the shadow misses the mark just as it approaches closest to its alleged target (and in an area where they was probably pavement on which the shadow could clearly be seen,)[12] is an indication that Buchner’s thesis is wrong. The simulation shows that the shadow clips the lower south end of the façade of the Ara Pacis just before sunset, when it disappears. We also note here that both the strong and weak interpretations are also thrown into doubt if, as we assume from the absence of any archaeological support, Buchner’s hypothesized pavement with an inscribed equinoctial line never existed. Without such a line, the average observer unversed in the subtleties of astronomy and gnomonology would have had little reason to process the significance of what he was seeing. Buchner’s thesis requires that the observer who does realize what is happening as the shadow advances across the zone to the Ara Pacis have the patience to stand and watch for some, or, ideally, all of the nearly twelve hours of daylight on that date. This seems impractical and implausible. Another decisive point against Buchner’s thesis is the fact that the shadow from the obelisk does hit the center of the western façade of the Ara Pacis at sunset on several other dates of the year. At most, then, one can say that Buchner had the right idea but concentrated on the wrong date. After they have been independently verified, we will report in a separate publication on the dates when the shadow does fall on the center of the western façade at sunset. In this regard, we note Suetonius’ comment (Augustus 31) that Augustus named Sextilis and not his birth month September after himself when he became pontifex maximus “because in the former he had won his first consulship and his most brilliant victories.” Here we have a nice parallel for Augustus’ decision-making in conferring honors on himself: he was not unduly influenced by his birthday but took other factors into consideration. Apparently, the same thing was true of the design he commissioned for the alignment of the obelisk with the Ara Pacis. Finally, and this is the most decisive point against the Buchner thesis, the phasing outlined in section 3(c) makes purely coincidental any shadow effect involving the hypothesized horologium and the Ara Pacis since the Ara Pacis was designed and sited first, the obelisk second, and the horologium (or, as we would instead assert, following Albéri Auber, the meridian) was added as an afterthought.
Pollini 2012:210-216 reports on and illustrates (see, especially, p. 215, figure V.7e) a computer simulation that appears to confirm the strong version of Buchner’s thesis. We were naturally concerned about this result, which contradicts our own. Pollini and his modeler, N. Cipolla, kindly answered questions about their methods and software. We learned that Cipolla used formZ as his modeling package and for the lighting solution showing the shadow of the obelisk hitting the center of the western façade of the altar at 4:31 pm on September 23. As noted above in section 3, correct azimuthal, temporal and geospatial data are needed if the results of a simulation can have validity. Cipolla (personal communication, April 16, 2013) wrote that in creating a lighting solution for the shadow of the obelisk cast at 4:31 pm toward the western façade of the Ara Pacis, he used the built-in geocoordinates for Rome furnished by formZ. We determined that these coordinates are: 41 degrees, 54 minutes N, 12 degrees 30 minutes E. If we put these coordinates in Google Maps, we find that they yield an address near Stazione at via Giovanni Amendola 14-40, 00185 Rome. This location is ca. 2 km from where the obelisk was erected in antiquity. The spatial error is compounded by a temporal error. Cipolla also used formZ’s built-in time setting in his lighting solution. However, as a personal communication (dated April 30, 2013) from Paul Helm of the formZ Technical Support team states, “the formZ Sun Position is designed for current years, and not intended for historical use.” The position of the sun in the sky is quite different today than it was in the period under discussion. Here, too, formZ’s built-in data have contributed to the different—and, we would claim, erroneous–results seen in the Pollini-Cipolla simulation.
Heslin 2007:14 writes that “the shadow of the obelisk would have pointed at the Ara Pacis every single afternoon of the year…” Hannah 2011:94 notes that this is mistaken and that “in mid-winter, for example, it is not possible for the afternoon sun to cast a shadow that will fall from the obelisk towards anywhere near the direction of the altar.” The simulation, with its ability to instantly make complex calculations, allows us to confirm Hannah’s point and make it more precise. On the following dates, the shadow from the obelisk does not point at all toward the Ara Pacis: October 30 to February 11.
Schütz 1990:450-453 questions whether the shadow of the sphere of the obelisk on the Ara Pacis would have had salience. Hannah 2011:91-93 disputes this on the basis of autopsy of the shadow cast by the cenotaph in Dunedin. The simulation also shows that Schütz’s concern was misplaced.
Schütz 2011:85 claims that the Ara Pacis is not aligned with the shadow of the setting sun from the obelisk, but is oriented precisely away from the obelisk toward the rising sun to the east on April 21, the Parilia festival. The simulation shows that there is no precise alignment at sunrise on April 21 (figure 2), but there is such an alignment on May 6, a date with no festival on the religious calendar or other connection to Augustus, his family, or Roman history. It is therefore doubtless accidental—a coincidental result of another date (or dates) determining the design of the obelisk-Ara Pacis ensemble.
Schütz’s attempt to orient the Ara Pacis toward the sun may, however, turn out to be another good idea which, like Buchner’s regarding the shadow, was simply misapplied. Let us recall the phasing of the project (section 3[c]): the design and construction of the Ara Pacis preceded the installation of the obelisk. When it was erected in Rome, the obelisk was rotated to be nearly parallel to the orientation of the Ara Pacis. This rotation has no impact on the obelisk’s functionality as a gnomon for the (still later) meridian: the obelisk’s shadow falls at the correct cross-hatchings on the meridian line whether or not the obelisk, like the meridian, is oriented N-S. But the obelisk’s rotation does have an important visual relevance for the relationship of the obelisk to the Ara Pacis: the obelisk, added after construction of the altar was already underway, was sited and disposed so as to be aesthetically compatible with the altar for someone viewing both on axis from the east (i.e., from the via Flaminia). Here, a different rotation of the obelisk would have been dysfunctional, i.e., aesthetically unpleasing. By looking eastward toward the sunrise from the eastern entrance of the Ara Pacis, Schütz ignores the (to us) indisputable visual and positional relationship between the obelisk and the altar.
The idea of seeing a relationship between the Ara Pacis and the sun—and not, as Buchner thought, the sun’s shadow—is quite interesting, and Schütz deserves credit for introducing it into the debate. All over the world, archaeoastronomers have found evidence of such built “solar markers” (cf., e.g., s.v. solstice markers in the Index of Kelly and Milone 2011: 606). Finding one at Rome would thus not be unprecedented. In this connection, we may note that the obelisk is expressly dedicated to the Sun god (see above n.2). We are currently using the simulation to study this possibility and have identified three candidate pairs of dates. We note that given the nature of the analemma pattern traced by the sun in the sky each year, we will always find at least two dates (equidistant from the solstices) when any such alignment will occur. And, given the fact that when the observer moves along the axial line of the Ara Pacis imaginarily extended across the via Flaminia, the date of the alignment changes, we are likely to find more than one pair of candidate dates.
If arbitrary results are to be avoided in deciding which date (or, if this is another case of Augustan polysemy, dates; cf. Galinsky 1992) determined the positioning of the obelisk with respect to the altar, one needs rules of inquiry, and we state the rules we think reasonable to apply in the hope that they draw comment before our final report is published. First, there are the visual rules. What we are looking for must fulfill these visual criteria: the observer must be standing on the via Flaminia on axis with the eastern entrance to the Ara Pacis and with his gaze directed so that he can see the top of the obelisk in the distance; the disk of the sun must be more or less tangent to the top of the obelisk; and the disk must be (at least approximately) centered on the obelisk and, of course, on the axis of the Ara Pacis (figure 3). We think that the via Flaminia is the right place to use for observation because from here one had a good view of the entire façade of the Ara Pacis and the top part of the obelisk; and it was much more heavily trafficked than the adjacent area between the road and the eastern entrance to the altar. We assume that the effect we are looking for was exoteric, not esoteric: it was intended to be noticed by the mass of Romans passing through the Campus Martius and not simply by a select few. Then there is the cultural rule that a date is significant if and only if it corresponds to a well-attested religious festival, a personal event in the life of Augustus and his family, or an event of historic importance to the Roman state. We are, of course, aware of the fact when the requirements for a significant alignment are met for the observer stationed on the via Flaminia looking on axis from the east, then at the same time an observer positioned to the west on the imaginary axial line between the obelisk and the Ara Pacis would see the obelisk’s shadow projected onto the axis of the western entrance to the altar (figure 4). Our analysis, then, is in a sense an ironic (and, let us hope, irenic) compromise between the approaches of Buchner (=obelisk’s shadow centered on the western façade of the Ara Pacis) and of Schütz (=sun seen aligned to the main axis of the altar). However, to effect the compromise, we had to find better dates, and we had to turn Schütz ‘s ancient observer around so that she could see both the Ara Pacis and the obelisk, something possible only at sunset, not sunrise. We hasten to add that our results did not come from consciously working out such a compromise in advance and applying it to the simulation, but from using the simulation with no preconceptions as simply a device for virtual empirical survey and observation.[13]
We conclude by expressing the hope that our simulation does not itself become a new topic of the debate (which already includes more than enough controversies!). To reduce the chances that this will happen, before we will release any of our new findings along the lines of the compromise just described we will have the underlying calculations independently checked. And before we freely post the simulation itself on the Internet (as is our intention to do as a support for teaching and research), we want to modify it as suggested above in section 4 so that it is flexible enough to accommodate the complete range of expert views about the archaeological record.
Bibliography
Albèri Auber, Paolo, 2011-12. “L’obelisco di Augusto in Campo Marzio e la sua Linea Meridiana. Aggiornamenti e proposte,” Rendiconti della Pontificia Accademia Romana di Archeologia 84:447-580.
Albèri Auber, Paolo, 2013a. “La Linea meridiana di Augusto,” Orologi Solari, n. 2, CGI Coordinamento Gnomonico Italiano, August, 2013.
Albèri Auber, Paolo, 2013b. “The Obelisk of Augustus and its Meridian Line. Part 1,” The Compendium. Journal of the North American Sundial Society, September, 2013.
Buchner, E., 1976. “Solarium Augusti und Ara Pacis,” RömMitt 83, 3 19-65.
Buchner, E., 1980. “Horologium Solarium Augusti. Bericht über die Ausgrabungen 1979/80,”
RömMitt 87, 355-73.
Buchner, E., 1982. Die Sonnenuhr des Augustus (Mainz).
Buchner, E., 1982b. “L’orologio solare di Augusto,” RendPontAcc 53-54 ( 1980-82) 331-45.
Buchner, E., 1983. “Horologium Augusti. Neue Ausgrabungen in Rom,” Gymnasium 90,
494-508.
Buchner, E., 1984. “Sonnenuhr des Augustus und römischer Fuß,” in Bauplanung und
Bautheorie der Antike (DiskAB 4) 215-19.
Buchner, E., 1988. “Horologium solarium Augusti,” in Kaiser Augustus und die verlorene
Republik (exh. Cat., Berlin) 240-45.
Buchner, E., 1994. “Neues zur Sonnenuhr des Augustus,” Nürnberger Blätter zur
Archäologie 10 (1993-94) 77-84.
Buchner, E., 1996a. “Horologium Augusti,” in LTUR 3 (Rome) 35-37.
Buchner, E., 1996b. “Ein Kanal für Obelisken. Neues vom Mausoleum des Augustus in Rom,”
AntW 27, 161-68.
Buchner, E., 1999. “Horologium Augusti,” in Via del Corso. Una strada lunga 2000 anni
(exh. cat., Rome) 159-63.
.
Favro, D., 1996. The urban image of Augustan Rome (Cambridge).
Frischer, B., 2008. “From digital illustration to digital heuristics,” in Beyond Illustration: 2D and 3D Digital Technologies as Tools for Discovery in Archaeology, edited by Bernard Frischer and Anastasia Dakouri-Hild, BAR International Series 1805 (Oxford) v-xxiv.
Frischer, B.and J. Fillwalk, 2013. “ A Computer Simulation to Test the Buchner Thesis. The Relationship of the Ara Pacis and the Meridian in the Campus Martius, Rome,” Proceedings of Digital Heritage 2013, forthcoming.
Galinsky, K., 1992. “Venus, polysemy, and the Ara Pacis Augustae,” AJA 96, 457-75.
Galison, P., 1997. Image & logic. A material culture of microphysics (Chicago and London).
Hannah, R., 2009. Time in antiquity (London and New York).
Hannah, R., 2011. “The Horologium of Augustus as a sundial,” JRA 24, 87-95.
Haselberger, L., 2011. “A debate on the Horologium of Augustus: Controversy and clarifications,” JRA 24, 47-73.
Heslin, P. J., 2007. “Augustus, Domitian and the so-called Horologium Augusti,” JRS 97, 1-20.
Heslin, P. J., 2011. “The Augustus code: A response to L. Haselberger,” JRA 24,74-77.
Humphreys, P., 2004. Extending ourselves. Computational science, empiricism, and scientific method (Oxford and New York).
La Rocca, E., 1983. Ara Pacis Augstae in occasione del restauro della fronte orientale (Rome).
Liverani, P., 2006-7. “Templa duo nova Spei et Fortunae in Campo Marzio,” RendPontAcc 79, 291-314.
Rakob, F. 1987. “Die Urbanisierung des nördlichen Marsfeldes. Neue Forschungen im Areal des Horologium Augusti,” in L’Urbs. Espace urbain et histoire (CollEFR 98) 687-712.
Rehak, P, 2006. Imperium and cosmos. Augustus and the Northern Campus Martius, edited by John G. Younger (The University of Wisconsin Press, Madison).
Rodríguez-Almeida, E., 1980. “Il Campo Marzio settentrionale: solarium e pomerium,” RendAccPont 51-52, 195-212.
Rossini, O., 2006. Ara Pacis (Milan).
Schütz, M., 1990. “Zur Sonnenuhr des Augustus auf dem Marsfeld,” Gymnasium 97, 432-457.
Schütz, M., 2011. “The Horologium on the Campus Martius Reconsidered,” JRA 24, 78-86.
Torellli, M., 1992. “Topografia e iconologia. Arco di Portogallo, Ara Pacis, Ara Providentiae, Templum Solis,” Ostraka 1: 105-131.
Torelli, M., 1999. “Pax Augusta, Ara,” in LTUR 4 (Rome) 70-74.
Zanker, P., 1988. The Power of images in the age of Augustus (Ann Arbor).
Figures and Captions
Figure 1. At sunset on September 23, 1 CE, the shadow of the obelisk does not hit the middle of the western façade of the Ara Pacis as required by Buchner’s thesis but, as seen in this illustration, it only grazes the lower right side of the façade before continuing to the right (south) beyond the altar and soon disappearing after sunset. Source: Frischer-Fillwalk simulation.
Figure 2. Sunrise on April 21 (Parilia) of 1 CE seen from the eastern doorway of the Ara Pacis. According to Schütz 2011, 85 the Ara Pacis is oriented in such a way as to be on axis with the rising sun on this date. The doted red line gives the vertical axis and shows that Schütz’s theory is not confirmed by the simulation. Source: Frischer-Fillwalk simulation.
Figure 3. The Ara Pacis and upper part of the obelisk seen in “Ara Pacis View” from the via Flaminia in the Frischer-Fillwalk simulation. This striking effect appears to have occurred on several days of the year. Before releasing the dates and discussing their possible significance, we are having them independently verified. Source: Frischer-Fillwalk simulation.
Figure 4. The shadow of the obelisk projected onto the vertical axis of the western façade of the Ara Pacis seen in “Ara Pacis View” from a position along the axial line from the base of the obelisk to the center of the Ara Pacis, as seen in the Frischer-Fillwalk simulation. The dotted red line indicates the vertical axis, on which the shadow appears to be precisely centered. The date and time are the same as in figure 3. Source: Frischer-Fillwalk simulation.
[1] We are honored that Lothar Haselberger has invited us to contribute to this volume. We thank the National Science Foundation for the funding that made the Digital Meridian Project possible. We also thank Paolo Albèri Auber and Robert Hannah for their constant responsiveness to requests for information, help and collaboration. We are grateful to Nicholas Cipolla, David Dearborn, Karl Galinsky, Mika Kajava, Ann-Marie Lewis, Paolo Liverani, John Miller, John ollini, and Michael Schütz for answering questions and providing the information we requested. Franco Sgariglia kindly arranged our several visits to study the remains of the meridian found by E. Buchner under via di Campo Marzio 48. Needless to say, we are solely responsible for the data and interpretations presented in this report. Bernard Frischer wrote this report, was the principal investigator of the NSF grant, and is responsible for the archaeology behind the simulation; John Fillwalk edited the text of this report and is responsible for the creation of the digital simulation and related solar tracker plug-in.
[2] Ca. 1.0 degree at sunrise and sunset and 0 .5 degrees at other times of the day.
[3] The date is given by mention in the dedicatory inscription of Augustus’ holding of tribunician power for the fourteenth time (CIL VI.701 and 702; ILS 91).
[4] So J.-C. Grenier, LTUR 3 s.v. Obeliscus Augusti: Circus Maximus (Rome 1996) 355-356 at p. 356.
[5] In his contribution to the present volume, Albèri Auber rightly stresses that in NH 36.72 Pliny uses the word “addidit” twice in connection with the meridian and related sphere atop the obelisk: Ei, qui est in campo, divus Augustus addidit mirabilem usum ad deprendendas solis umbras dierumque ac noctium ita magnitudines, strato lapide ad longitudinem obelisci, cui par fieret umbra brumae confectae die sexta hora paulatimque per regulas, quae sunt ex aere inclusae, singulis diebus decresceret ac rursus augeresceret, digna cognitu res, ingenio Facundi Novi mathematici. is apici auratam pilam addidit, cuius vertice umbra colligeretur in se ipsam, alias enormiter iaculante apice, ratione, ut ferunt, a capite hominis intellecta. The meridian was a genial afterthought to a project already complete when the obelisk had been installed in the Campus Martius. On the basis of the fact that the obelisk is rotated by 15 degrees from N, the same point was made as early as 1750 by J. Stuart apud Bandini 1750: letter XIII, p. LXXIV.
[6] Schütz 1990:438 cogently notes in this connection that distanziatori are not seen on the relief of Antoninus and Faustina illustrating the obelisk.
[7] Albèri Auber 2011-12:467. Schütz 1990:442 may be right that for Buchner the choice of 100 Roman feet stemmed solely from “a fascination from round numbers,” but for Albèri Auber the decision was made for purely hard-headed, practical reasons. Moreover, Schütz does not reckon with the fact that there was a single, Augustan phase and that, according to Albèri Auber, the meridian was elevated by 60 cm on an embankment off the virgin soil (Buchner’s Flavian phase). So, in a sense, both Schütz and Albèri Auber can be right: the obelisk, including its base was higher off the virgin soil than 100 Roman feet; but since the meridian was also raised off the virgin soil—in Albèri Auber’s view, to offer some protection against the flooding of the Tiber (but, we would note, possibly because the quota level of the virgin soil was lower at the obelisk end of the meridian than at its northern limit; cf. Rodriguez-Almeida 1982:208) —then the effective height of the sphere of the obelisk off the pavement of the meridian was still 100 Roman feet.
[8] See, for example: Schütz 1990: 451; Favro 1996:130; Rehak 2006:83; Hannah and Magli 2011:506. In a rare lapsus memoriae, Torelli 1999:70, writes that the “shadow of the obelisk-gnomon touched the figure of Augustus represented on the frieze around the altar” (cf. also Torelli 1992:107). Torelli has rotated the Ara Pacis by 90 degrees. Correcting that error, we can add Torelli to the list of scholars holding to the strong interpretation of Buchner.
[9]Haselberger writes: “Buchner never speaks of the actual shadow reaching the Ara Pacis, but of the connection between Ara and Horlogium established through the equinoctial line.”
[10] At least on my photocopy, which may not be a perfect 1:1 reproduction; but the scale issue is irrelevant since it affects Buchner’s scale as well as his plan.
[11] E.g., La Rocca 1983:57, Zanker 1988:144, Rossini 2006:12.
[12] Pavement survives only on the south side of the Ara Pacis. See Haselberger 2011, 55.
[13] To confess the truth, the first author must admit to starting this project with the working assumption that Buchner’s thesis was more or less correct, as several generations of the students who have attended his lecture courses on Roman Topography at UCLA and the University of Virginia can attest.
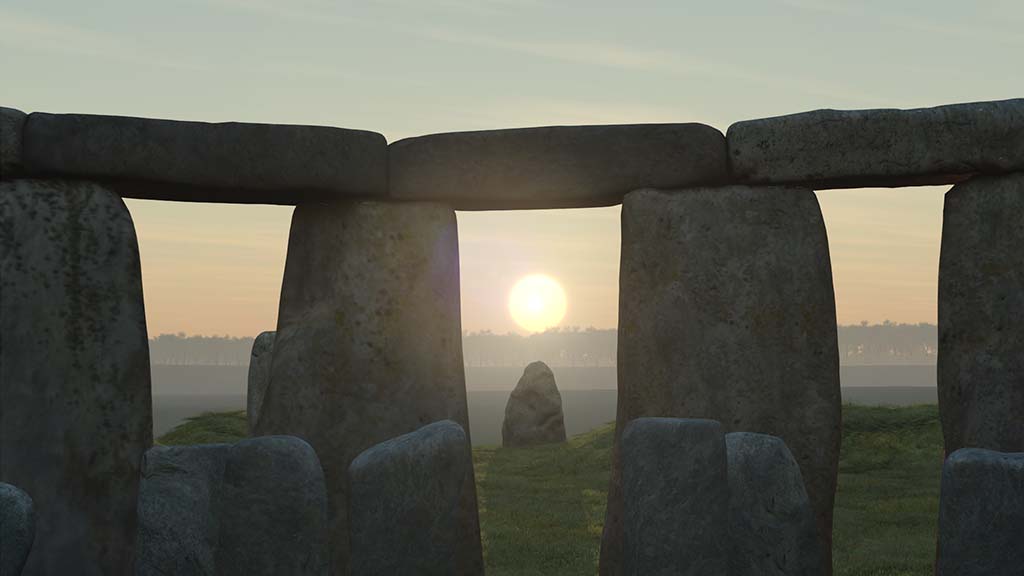
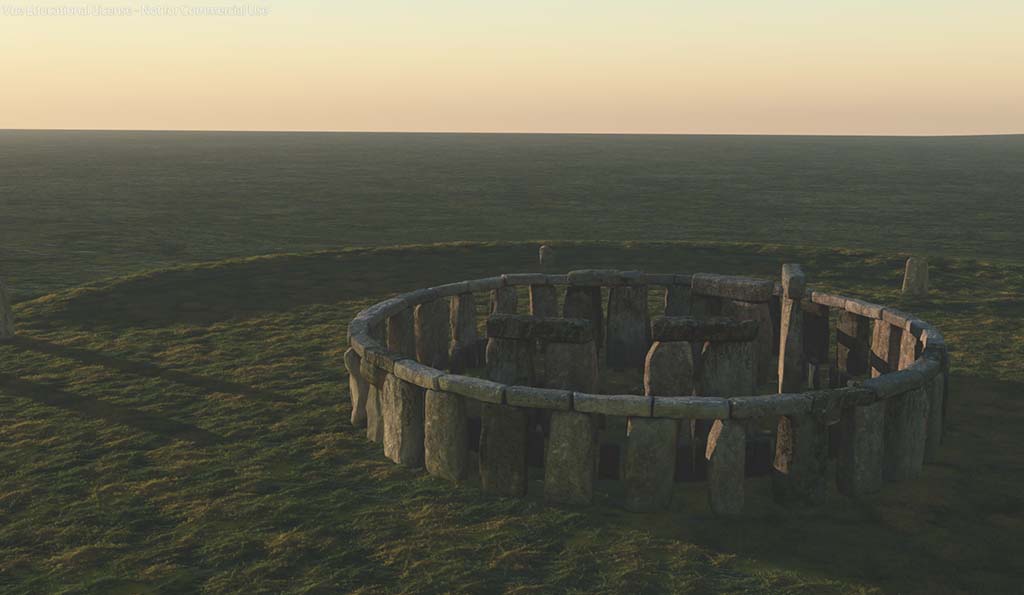
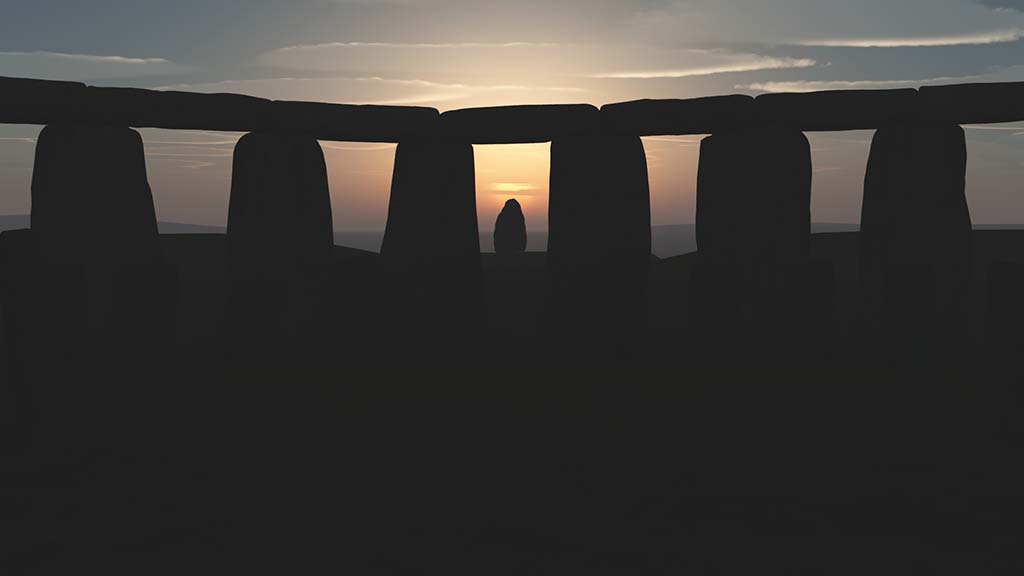
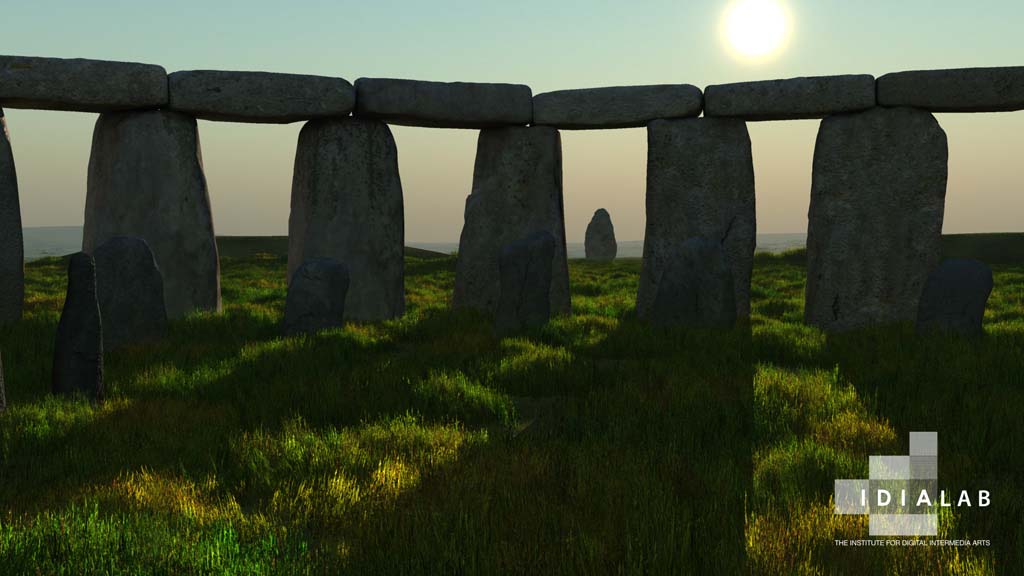
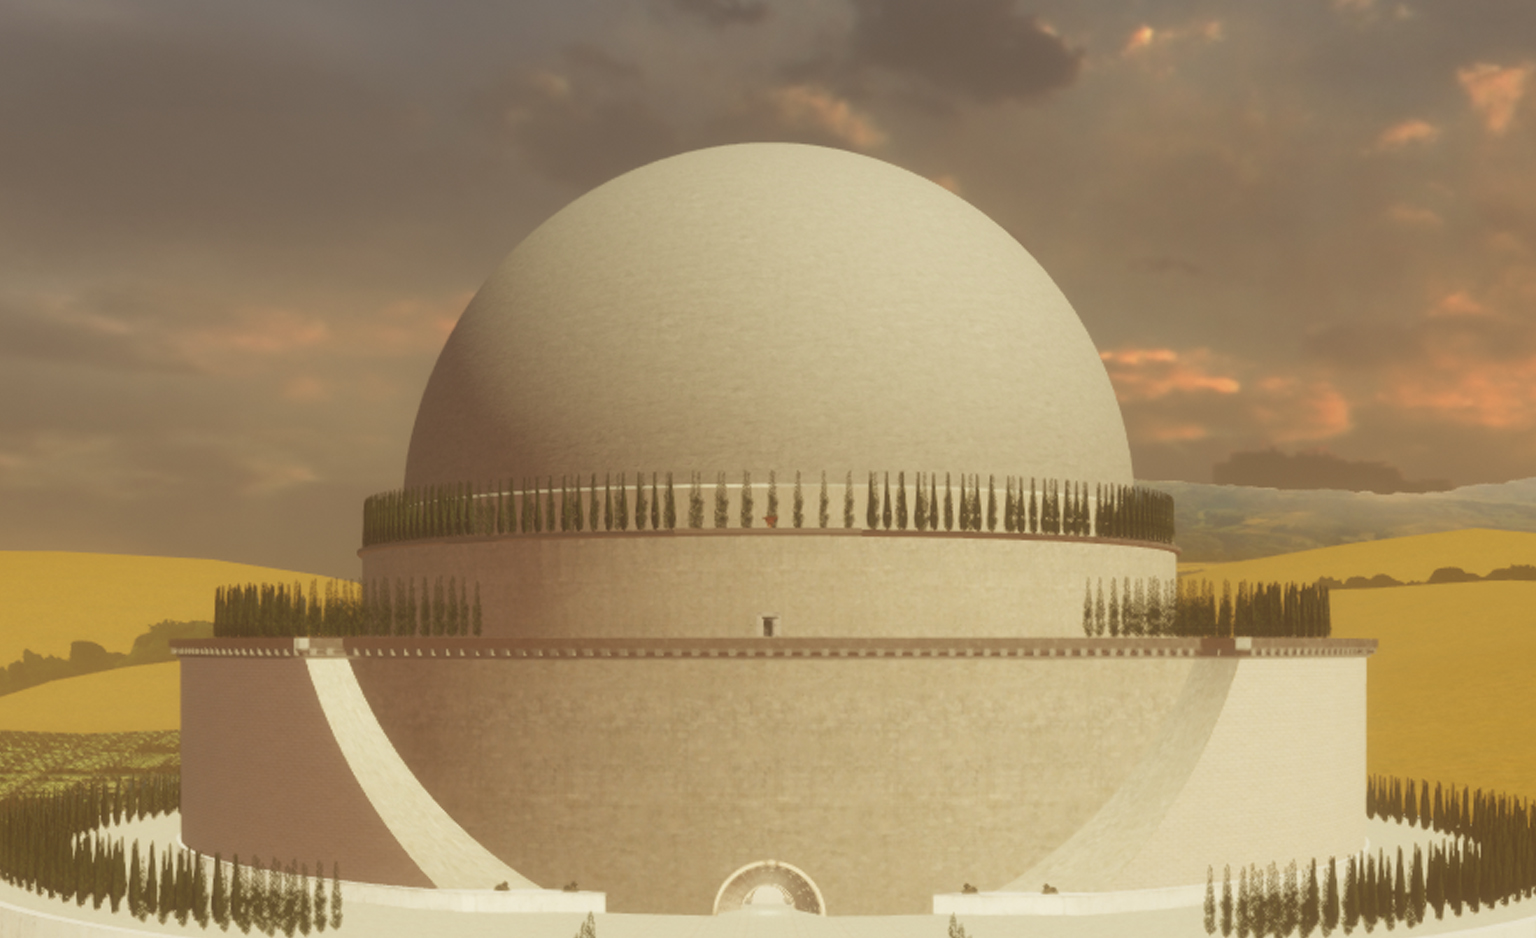
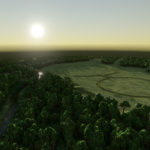
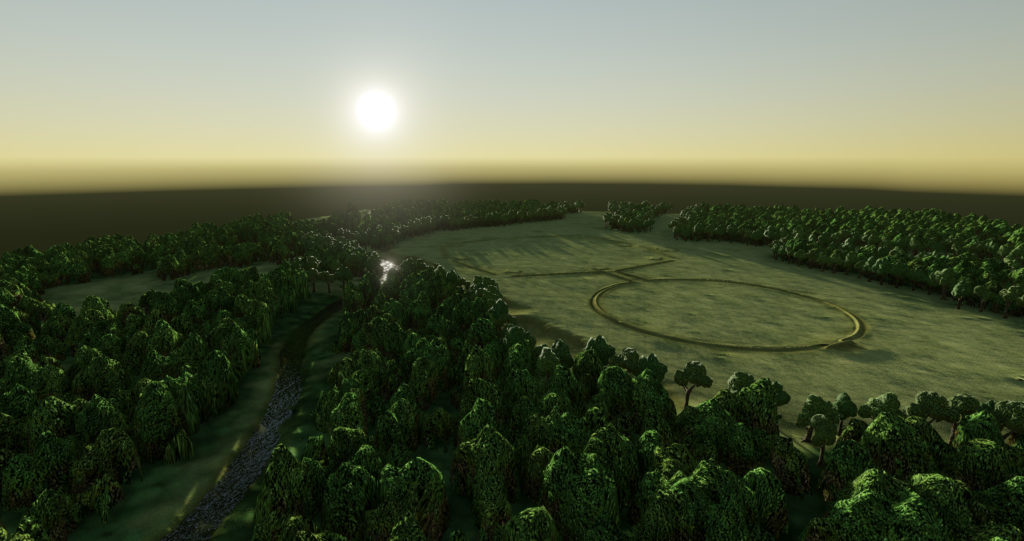
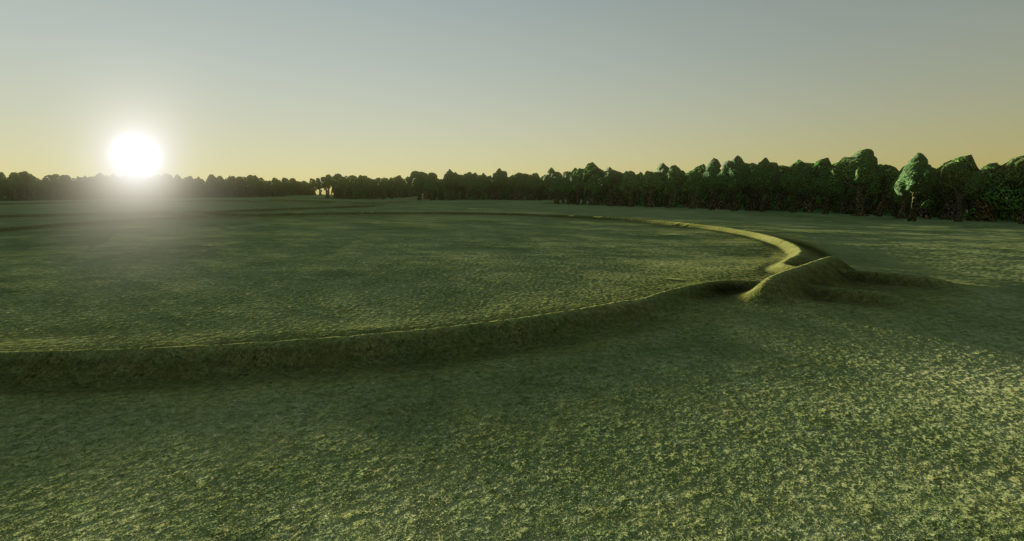
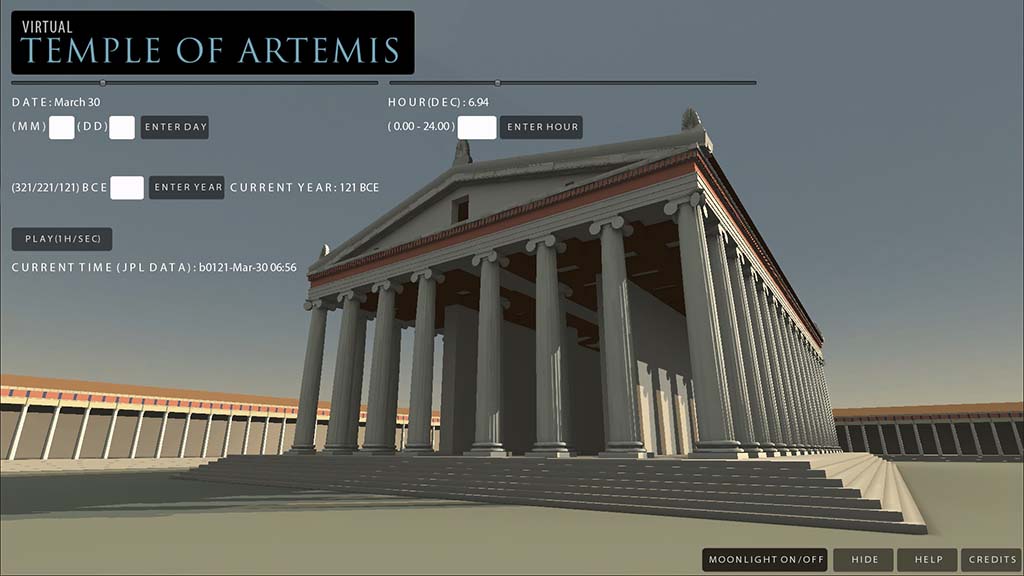
IDIA Lab has developed a simulation of Stonehenge in Unity 3D which illustrates the various stages of construction and celestial alignments in an interactive virtual simulator. The project incorporates IDIA Lab’s CelestialEngine which uses NASA JPL data to accurately position the sun, moon and visible planets – correcting for changes in time in the Earth’s rotation and other forces – allowing for accurate observations of the night sky as they would have appeared thousands of years ago at Stonehenge.
The History Channel’s television series The Universe recently shot segments of an upcoming Stonehenge episode at Ball State University’s IDIA Lab and will feature the use of our simulator and rendered animations throughout the hour long episode. http://www.history.com/shows/the-universe/episodes
The History Channel’s The Universe, Ancient Mysteries Solved: Stonehenge
Perhaps the most mysterious structure on Earth, Stonehenge has stood on a plain in Southern England for 5000 years. Why is it there? In this episode we explore the possibility that this was a prehistoric astronomical observatory. Here ancient astronomer priests may have divined the complex movements of the Sun and Moon, recognizing patterns that would not be discovered elsewhere for thousands of years. The primitive Shamans may have also been the first astronomers to predict eclipses.
Stonehenge
Introduction
Stonehenge is one of the most famous prehistoric sites in the world – consisting of a ring of standing stones set within large earthworks. It is in the middle of the most dense complex of Neolithic and Bronze Age monuments in England, including several hundred burial mounds.
Archaeologists believe the earliest phases were built approximately around 3000 BC with radiocarbon dating in 2008 suggesting that the first Sarsen stones were raised between 2400 and 2200 BC and that the bluestones may have been raised at the site as early as 3000 BC.
Archaeological evidence found by the Stonehenge Riverside Project in 2008 indicates that Stonehenge could have been a burial ground from its earliest beginnings. The dating of cremated remains found on the site indicates that deposits contain human bone from as early as 3000 BC, when the ditch and bank were first constructed.
PHASES
Phase One 3000-2920 BC
The first monument was essentially an earthwork, consisted of a circular bank and ditch enclosure measuring about 110 meters (360 ft.) in diameter, with a large entrance to the northeast and a smaller one to the south. It stood in open grassland on a slightly sloping spot. Within the outer edge of the enclosed bank is a circle of 56 holes each about a meter in diameter, known as the Aubrey holes after John Aubrey, a 17th-century antiquarian who was thought to have first identified them. Current thinking is that the Aubrey holes contained 56 bluestones during this phase of construction. There are suspected to be three heel stones during this era.
Phase Two 2620-2480 BC
Archaeological excavation has indicated that around 2600 BC, the builders reimagined the monument entirely – and began a massive phase of construction. During this period the sarsen ring with horizontal lintels was erected, the “U” shaped cluster of 5 central trilithons. These huge stones, ten uprights and five lintels, weigh up to 50 tons each. They were linked using complex jointing transferred from knowledge of woodworking. Also during this phase an inner ring of bluestones was constructed – most likely from the removal and relocation of the 56 Aubrey hole bluestones.
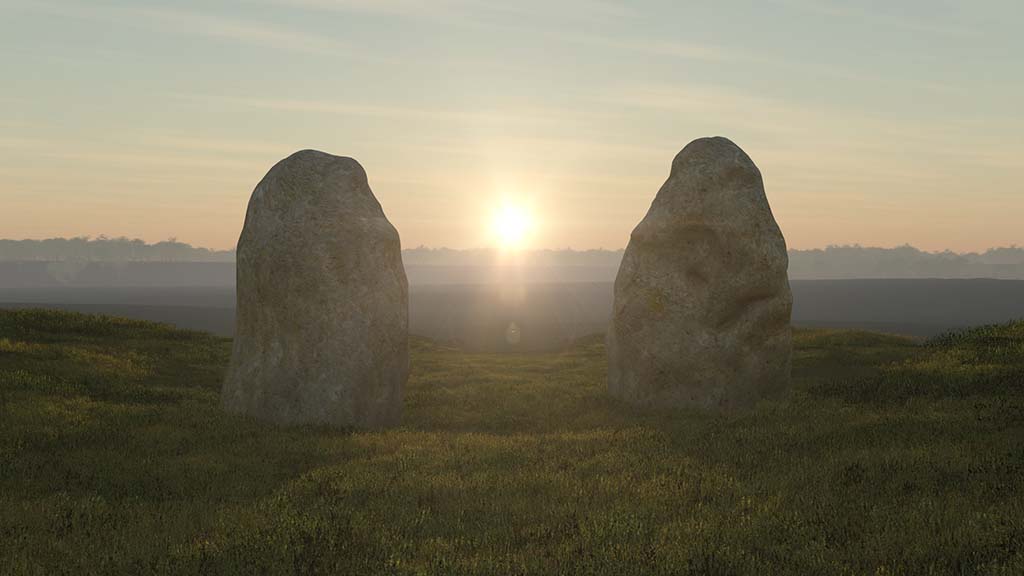
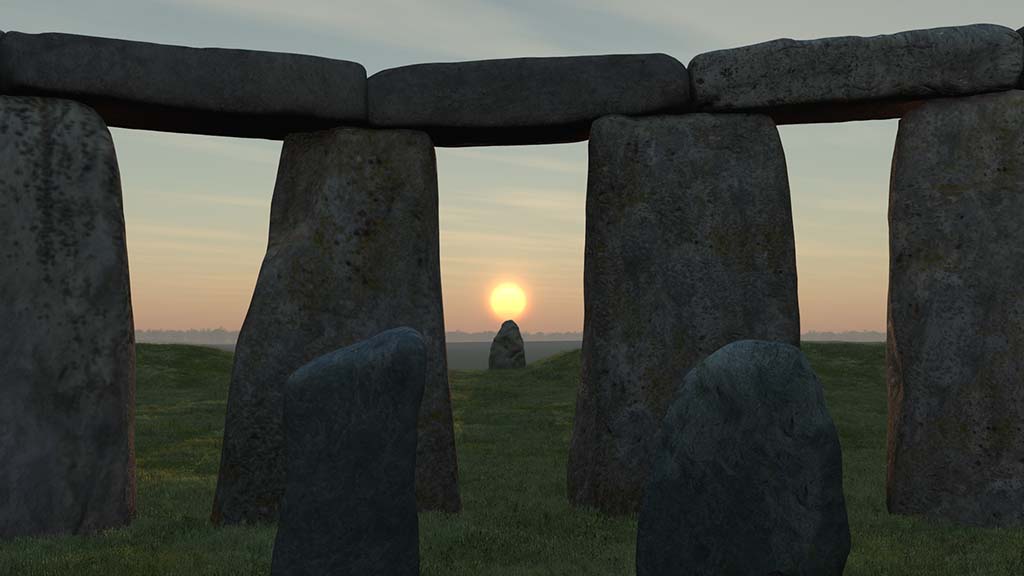
The earthwork was altered to create two barrows containing the addition of two of the station stones, with the remaining two outside the barrows, forming a rectangle. These station stones have both solar and lunar alignments. The heel stones were reduced to one – which stands somewhat angled today.
Phase Three 2480-2280 BC
In stage three the Avenue was constructed, a long roadway leading to the river Avon and leading to other settlements and monuments. A bluestone circle is constructed inside the ring of trilithons. This phase also noted the appearance of three slaughter stones.
Phase Four 2280-2020 BC
The main alteration of the monument during this period was the reconstruction of the bluestone configuration within the sarsen ring. They were reworked into two distinct patterns, one a central inner oval of 23 stones inside the trilithon ring – the other a circle of 59 stones between the trilithons and the sarsen ring. The remnants of both patterns are visible today. Also, the slaughter stones were reduced to one – which remains in a fallen state.
Phase Five 1680-1520 BC
The site is essentially unchanged with the exception of the construction of the X and Y holes. There are 30 Y holes and 29 Z holes – these are suspected to perhaps have significance in the tracking of the lunar month. The Y and Z Holes are the last known construction at Stonehenge, built about 1600 BC.
Present Day (1600 BC on)
Roman coins and medieval artifacts have all been found in or around the monument but it is unknown if the monument was in continuous use throughout British prehistory and beyond, or exactly how it would have been used. The Romans are believed to have removed 4 of the 23 inner bluestones from the oval, leaving the remaining 19 stones and holes forming the horseshoe we see today. The site was known to scholars during the Middle Ages and since then it has been studied and adopted by numerous groups.
Throughout the 20th century, Stonehenge began to be revived as a place of religious significance, by adherents of Neopagan and New Age beliefs, particularly the Neo-druids.
In the late 1920s a nation-wide appeal was launched to save Stonehenge from the encroachment of the modern buildings that had begun to rise around it. By 1928 the land around the monument had been purchased with the appeal donations, and given to the National Trust to preserve. The buildings were removed (although the roads were not), and the land returned to agriculture. More recently the land has been part of a grassland reversion scheme, successfully returning the surrounding fields to native chalk grassland.
Celestial Alignments
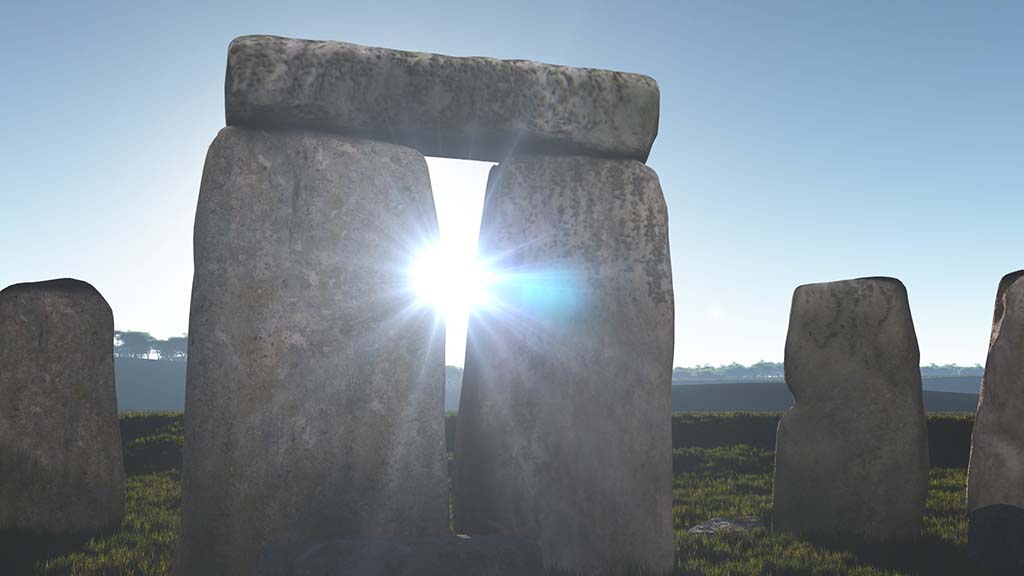
Many astronomical alignments have been attributed to Stonehenge, a complex of megaliths and earthworks in the Salisbury Plain of England. The most famous of these is the midsummer alignment, where the Sun rises over the Heel Stone.
As well as solar alignments, there are proposed lunar alignments. The four station stones mark out a rectangle. The short sides point towards the midsummer sunrise and midwinter sunset. The long sides if viewed towards the southeast, face the most southerly rising of the moon.
Gerald Hawkins, a professor and chair of the astronomy department at Boston University in the United States, published an analysis of Stonehenge in 1965 in which he proposed its purpose as an ancient astronomical observatory predicting movements of sun and stars. Archaeologists and other scholars have since demonstrated such sophisticated, complex planning and construction at other prehistoric earthwork sites across the globe.
Function and Construction
Stonehenge was produced by a culture that left no written records. Many aspects of Stonehenge remain subject to debate. There is little or no direct evidence for the construction techniques used by the Stonehenge builders. Proposed functions for the site include usage as an astronomical observatory or as a religious site.
Professor Michael Parker Pearson of Sheffield University has suggested that Stonehenge was part of a ritual landscape and was joined to Durrington Walls by their corresponding avenues and the River Avon. He suggests that the area around Durrington Walls Henge was a place of the living, whilst Stonehenge was a domain of the dead. A journey along the Avon to reach Stonehenge was part of a ritual passage from life to death, to celebrate past ancestors and the recently deceased. Whatever religious, mystical or spiritual elements were central to Stonehenge, its design includes a celestial observatory function, which might have allowed prediction of eclipse, solstice, equinox and other celestial events important to a contemporary religion.
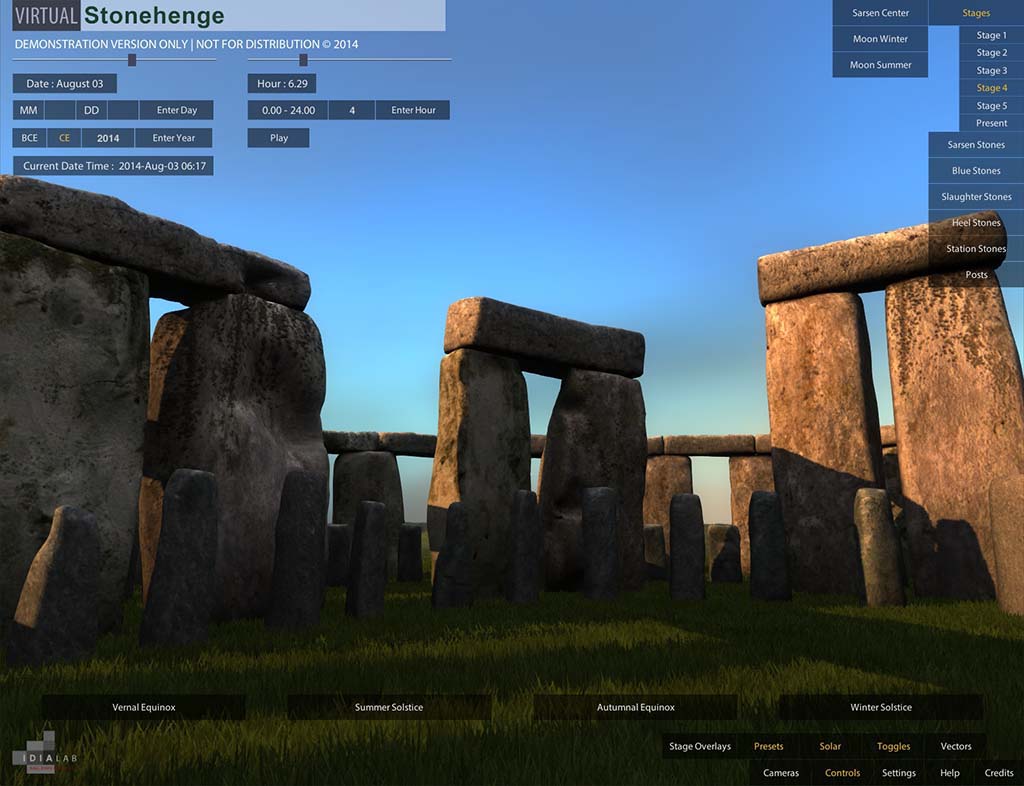
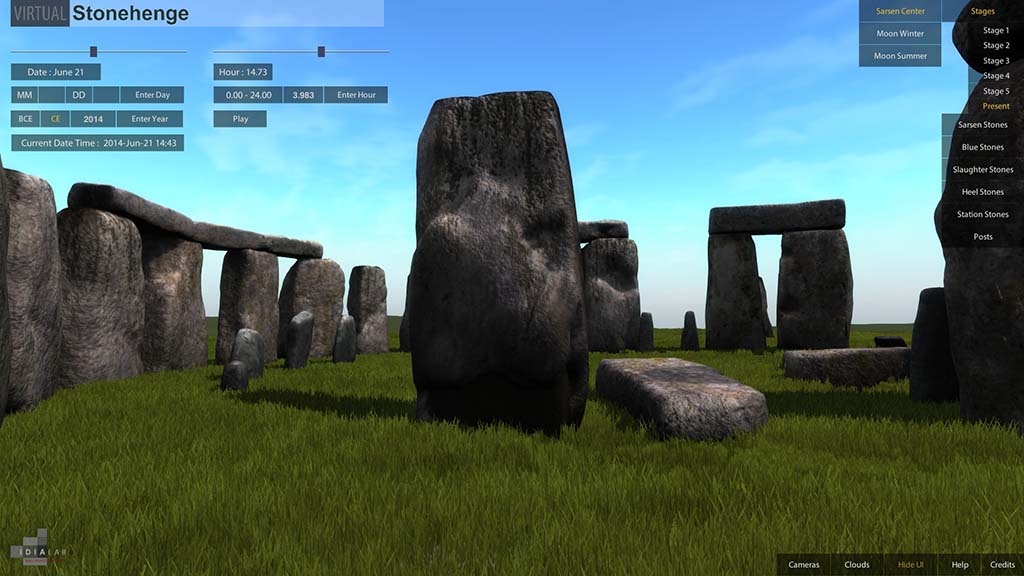
IDIA Lab Virtual Stonehenge Simulator
IDIA Lab has developed a simulation of Stonehenge that illustrates the various stages of construction and celestial alignments in an interactive virtual simulator. The project incorporates IDIA Lab’s Celestial SimEngine which uses NASA JPL data to accurately position the sun, moon and visible planets – correcting for changes in time in the earths rotation and other forces – allowing for accurate observations of the night sky as they would have appeared thousands of years ago at Stonehenge. https://idialab.org/virtual-stonehenge/
________________________________________
BBC The Sky at Night Episode
This past summer, BBC’s program, The Sky at Night also included IDIA Lab’s Stonehenge simulation and animation in an episode about Stonehenge and the summer solstice. The Sky at Night is a 50 year running program on astronomy which airs on BBC One, Two, Three and Four.
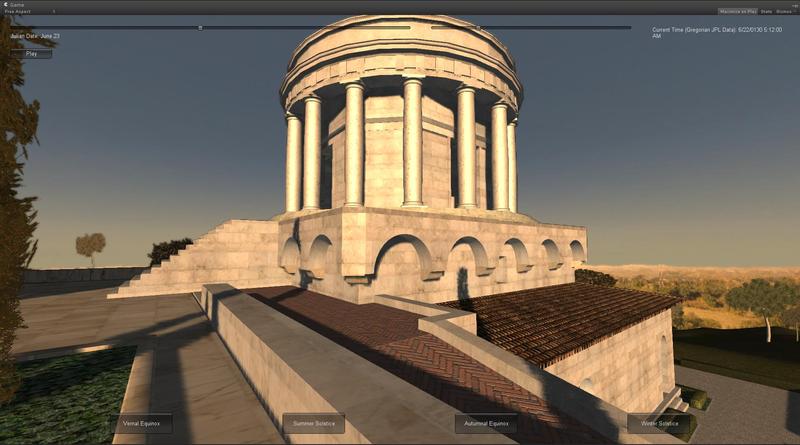
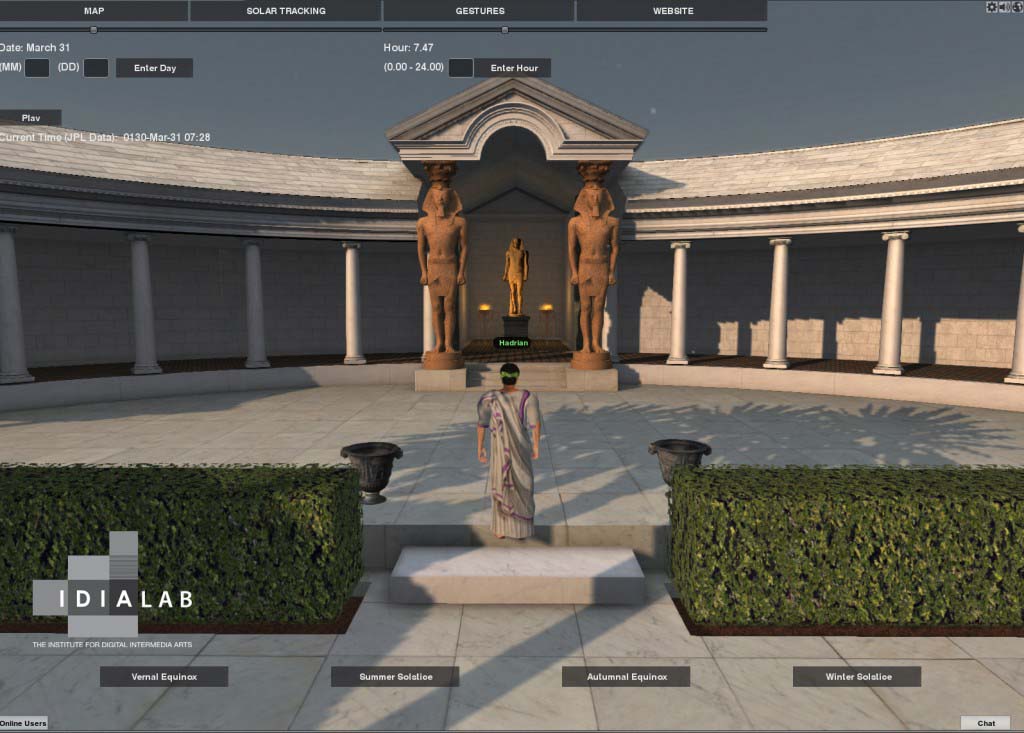
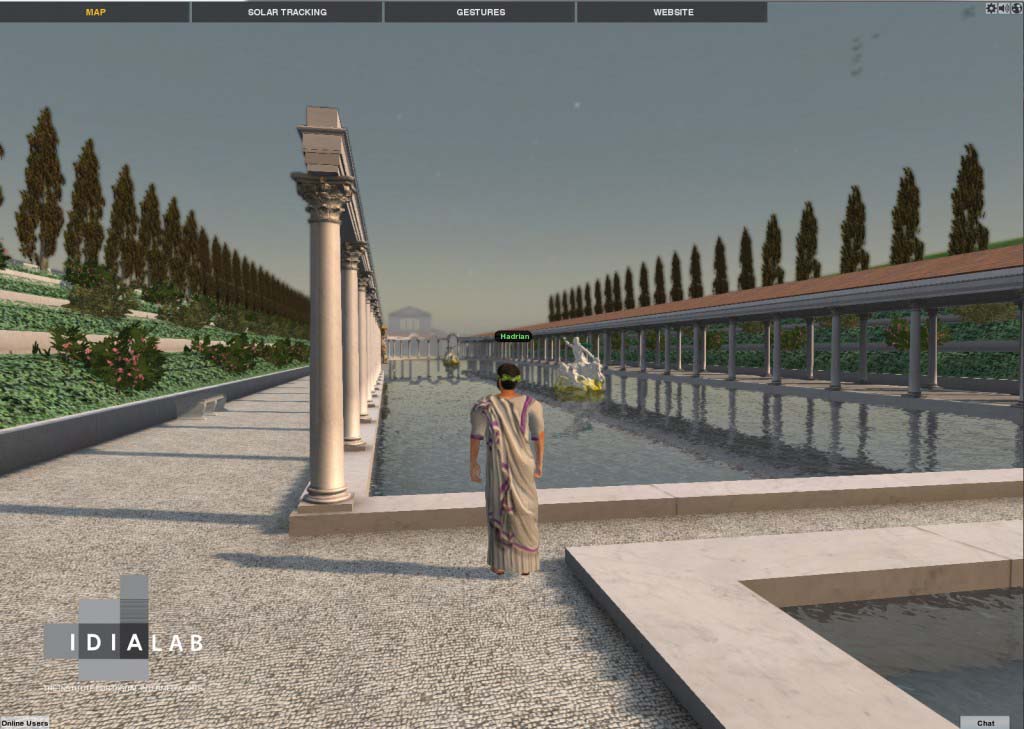
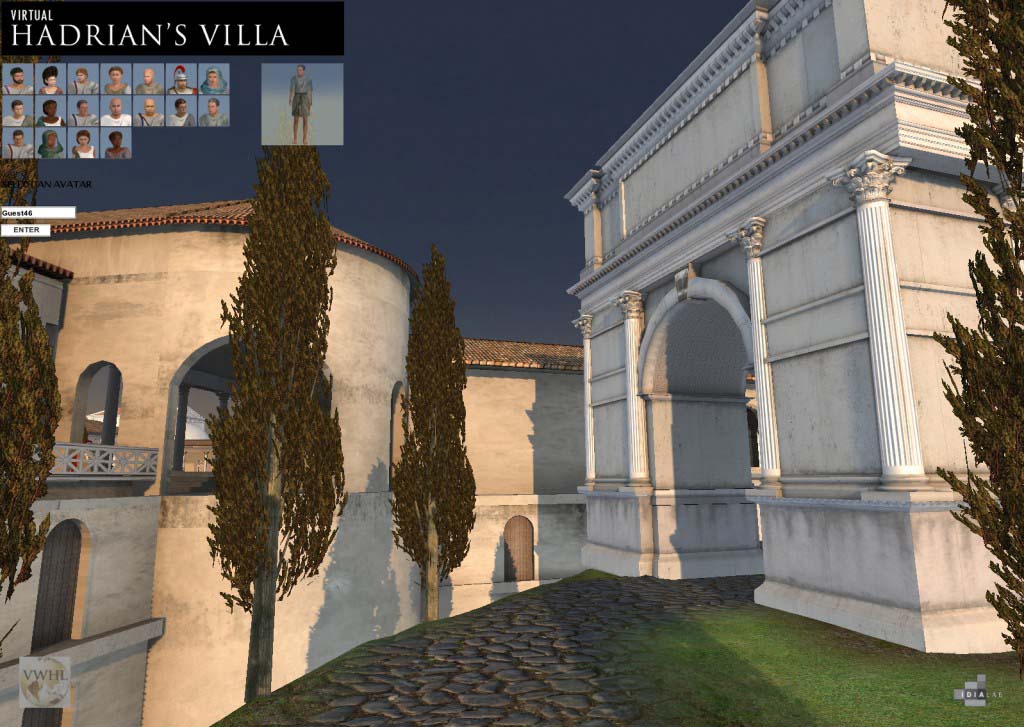
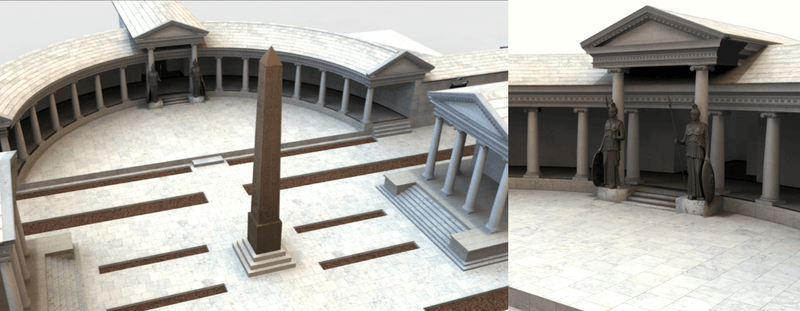
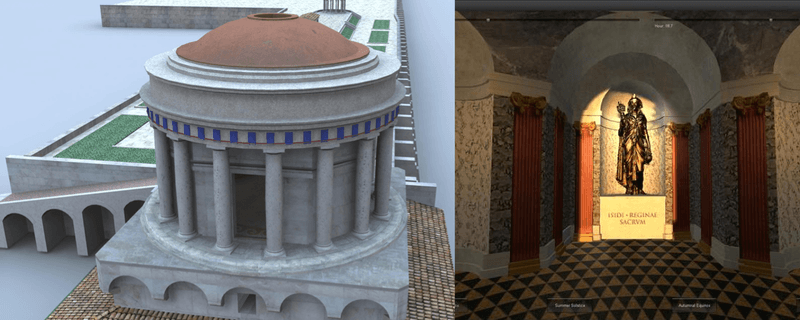
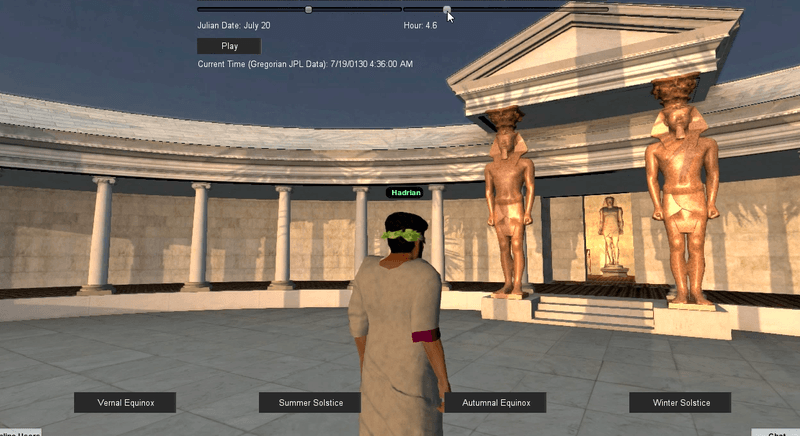
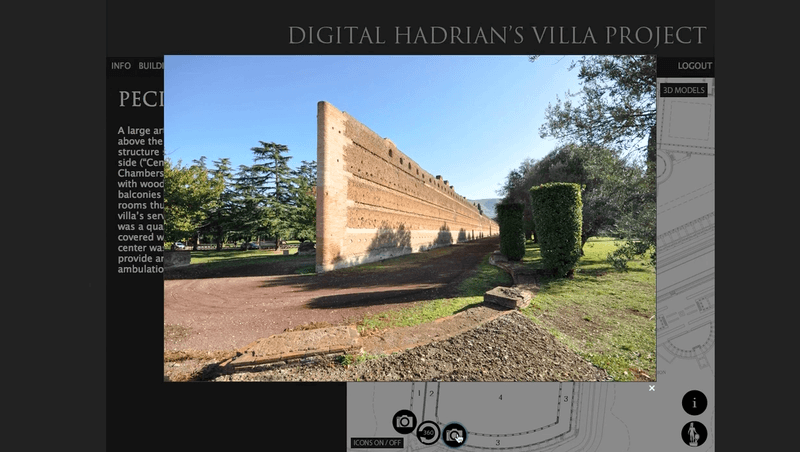
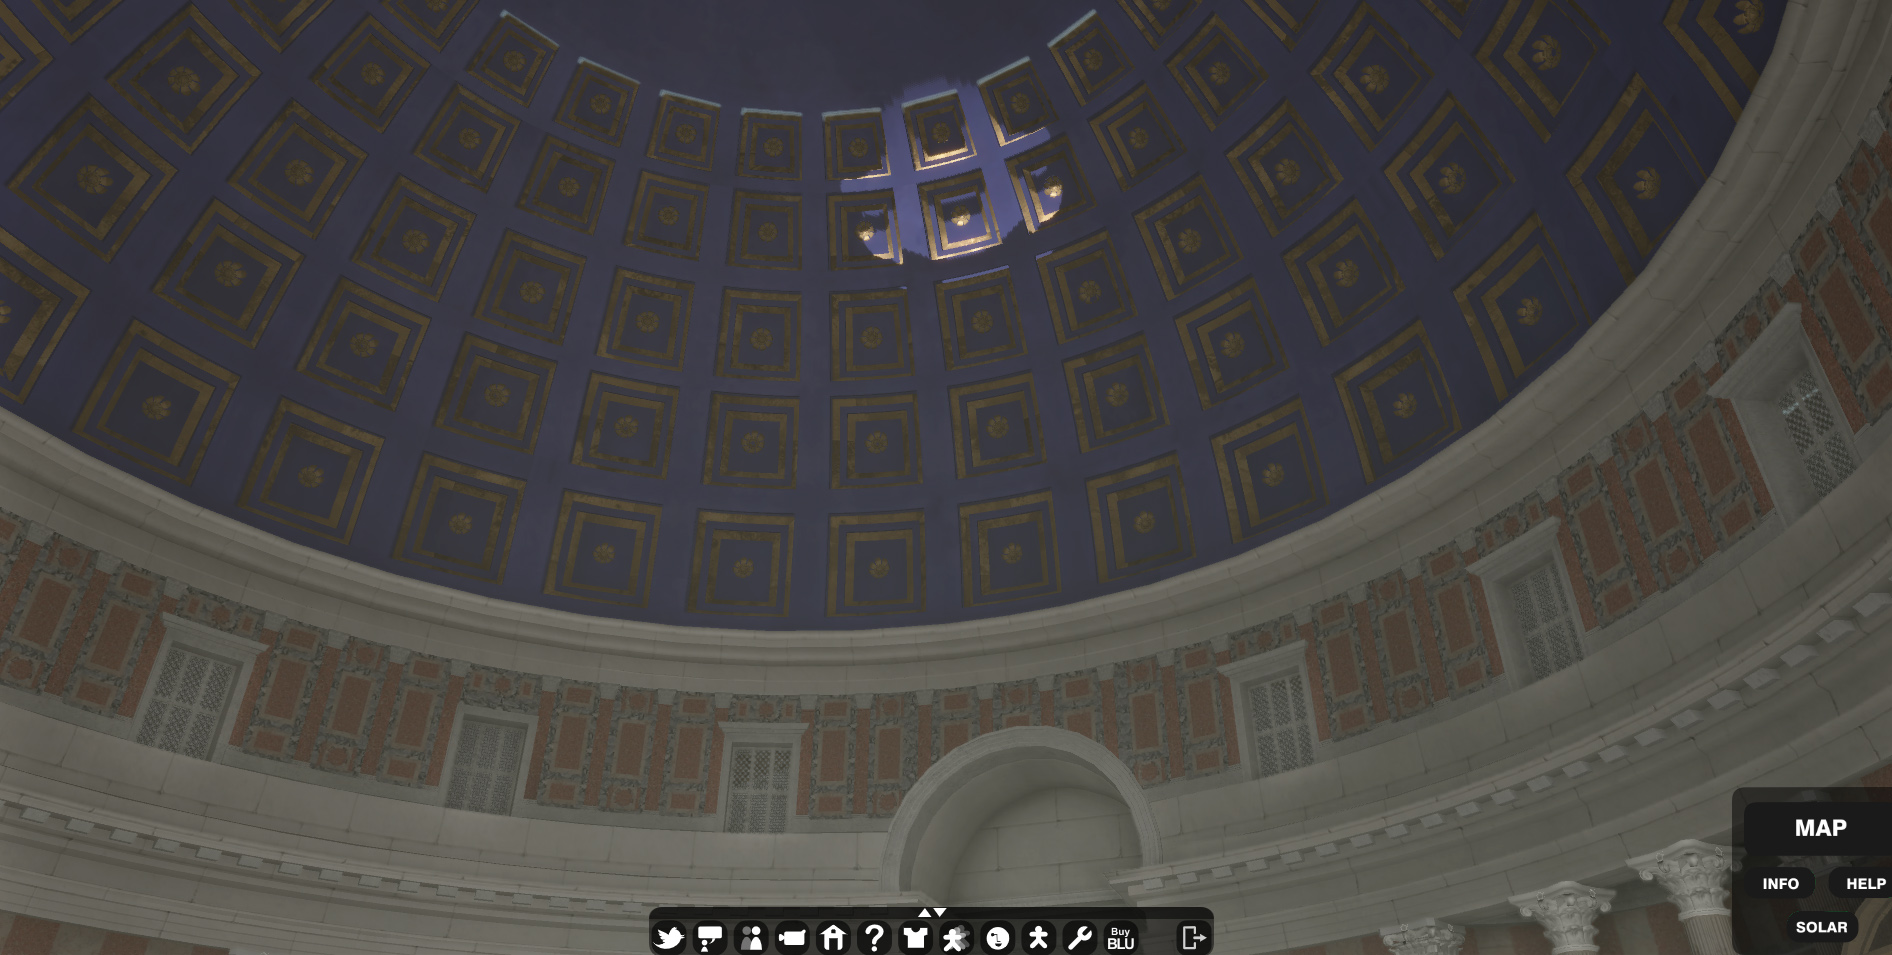
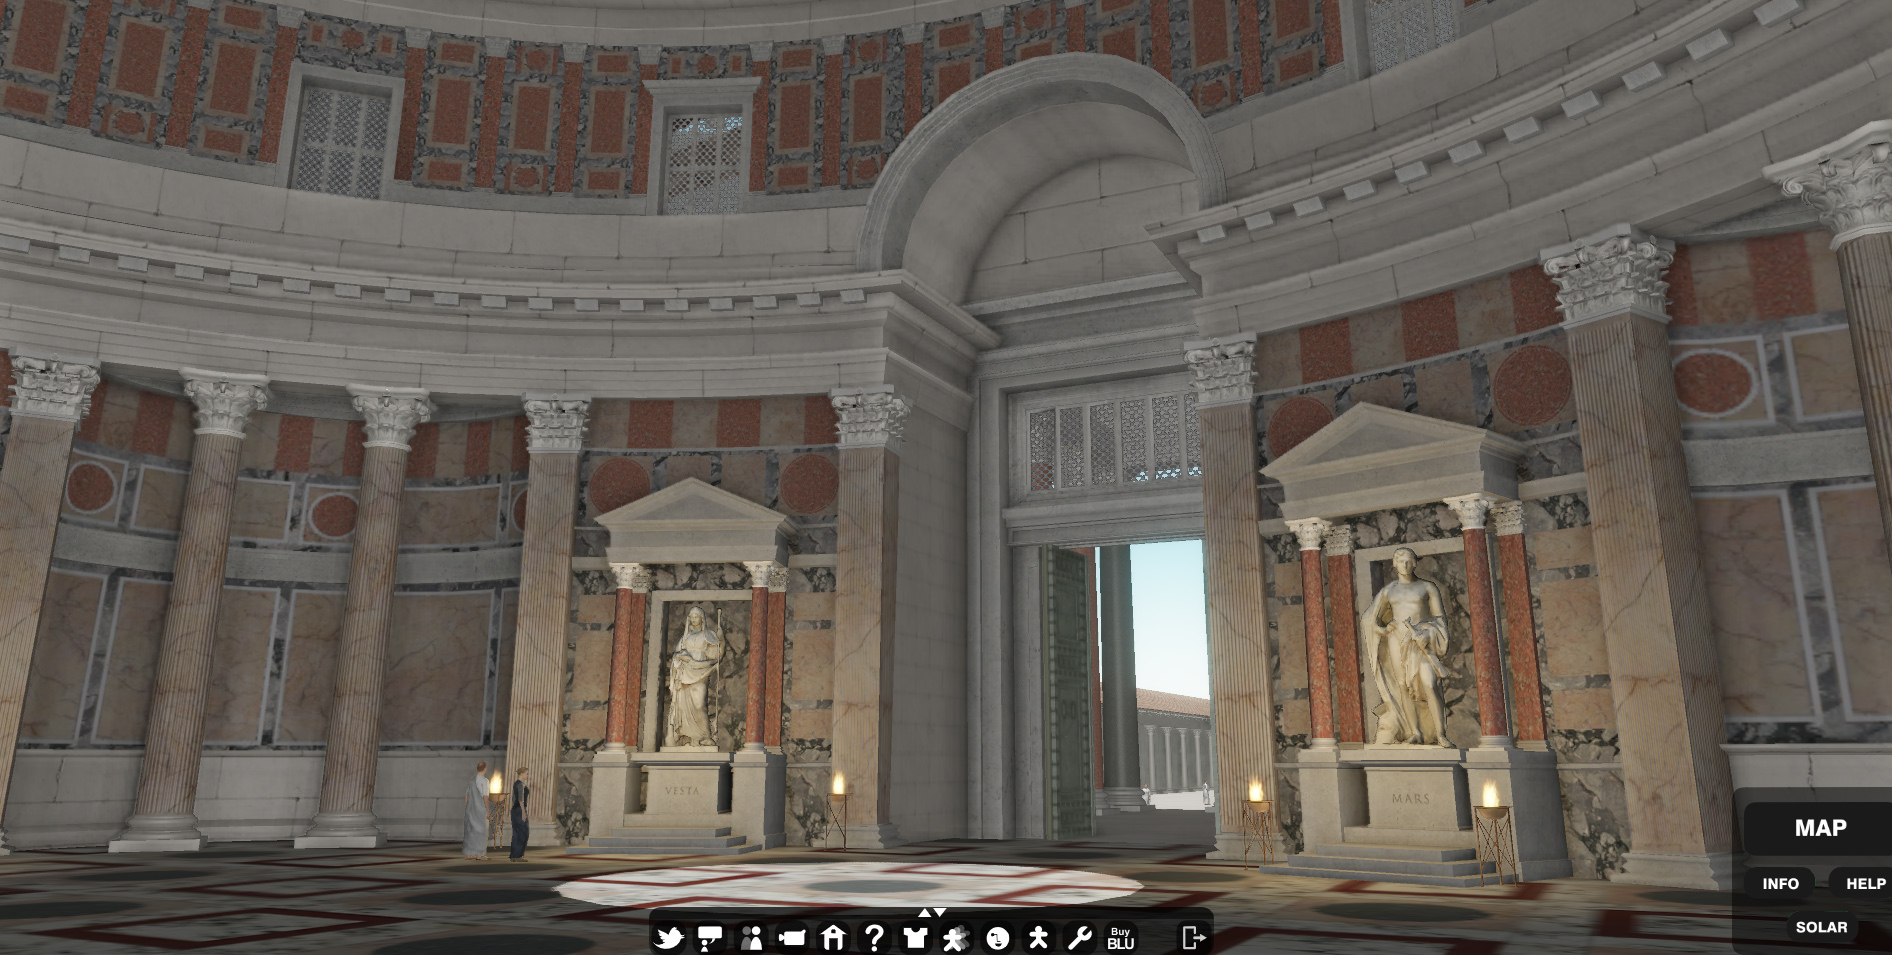
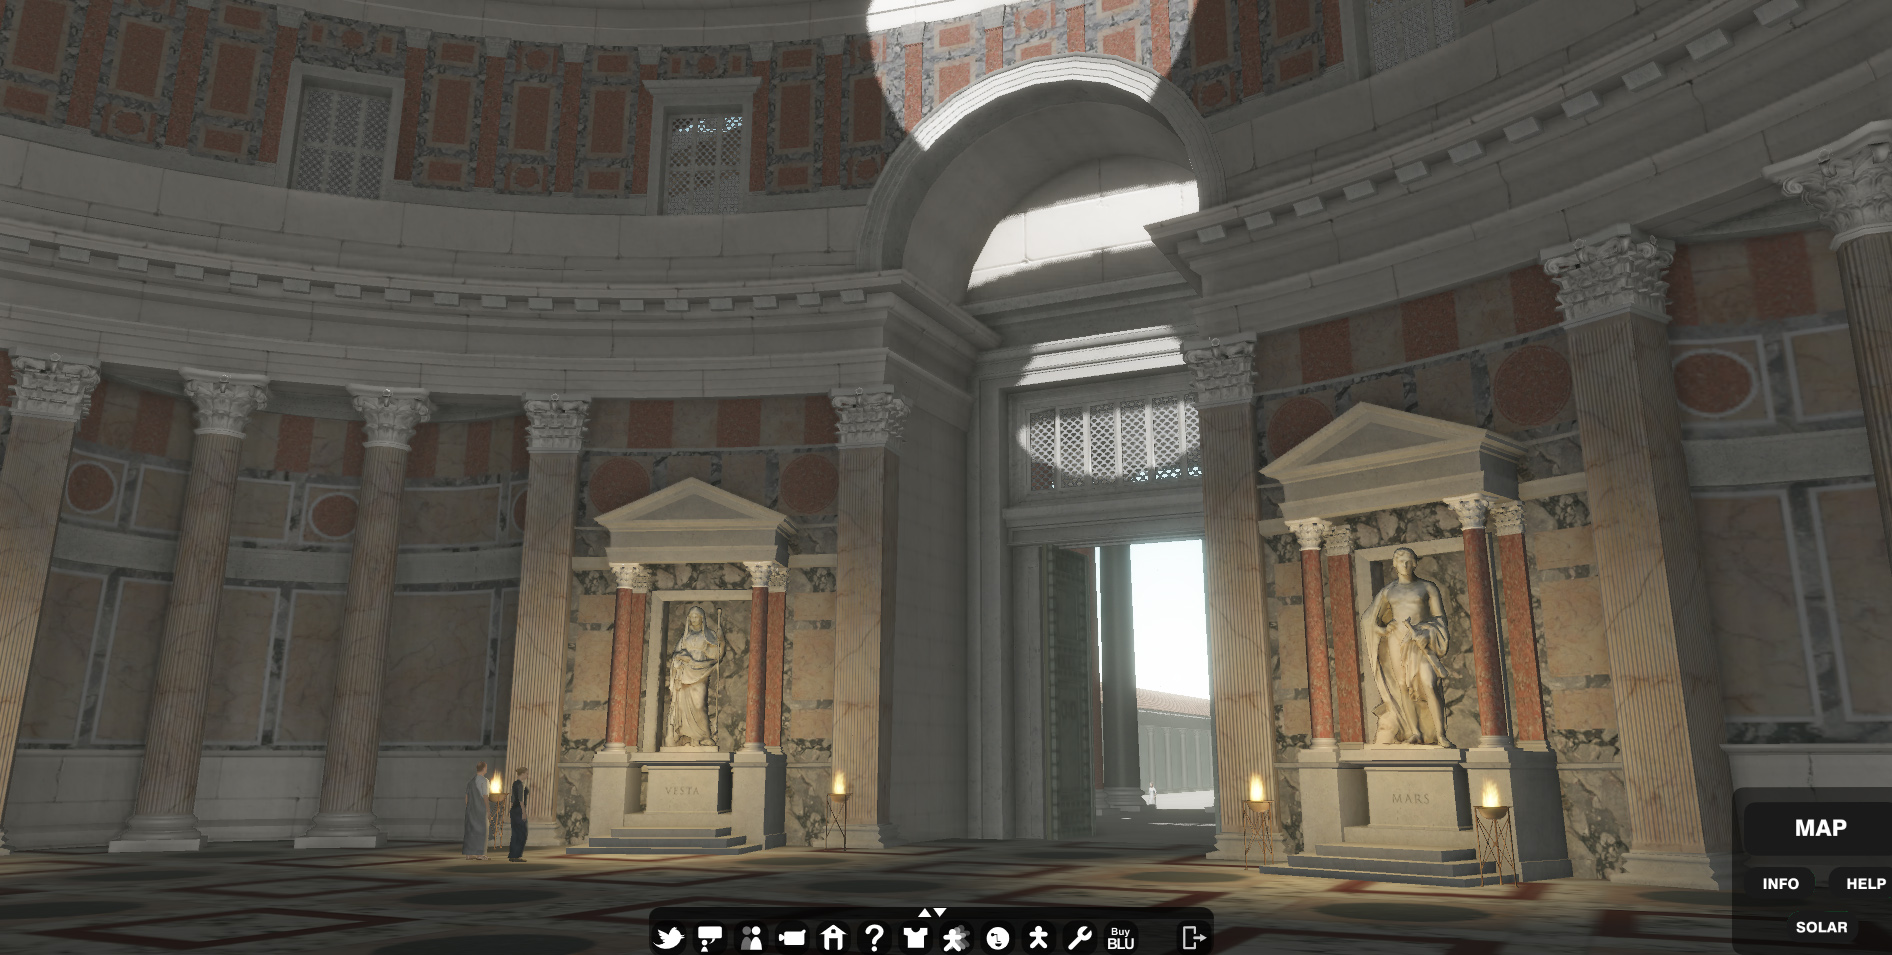
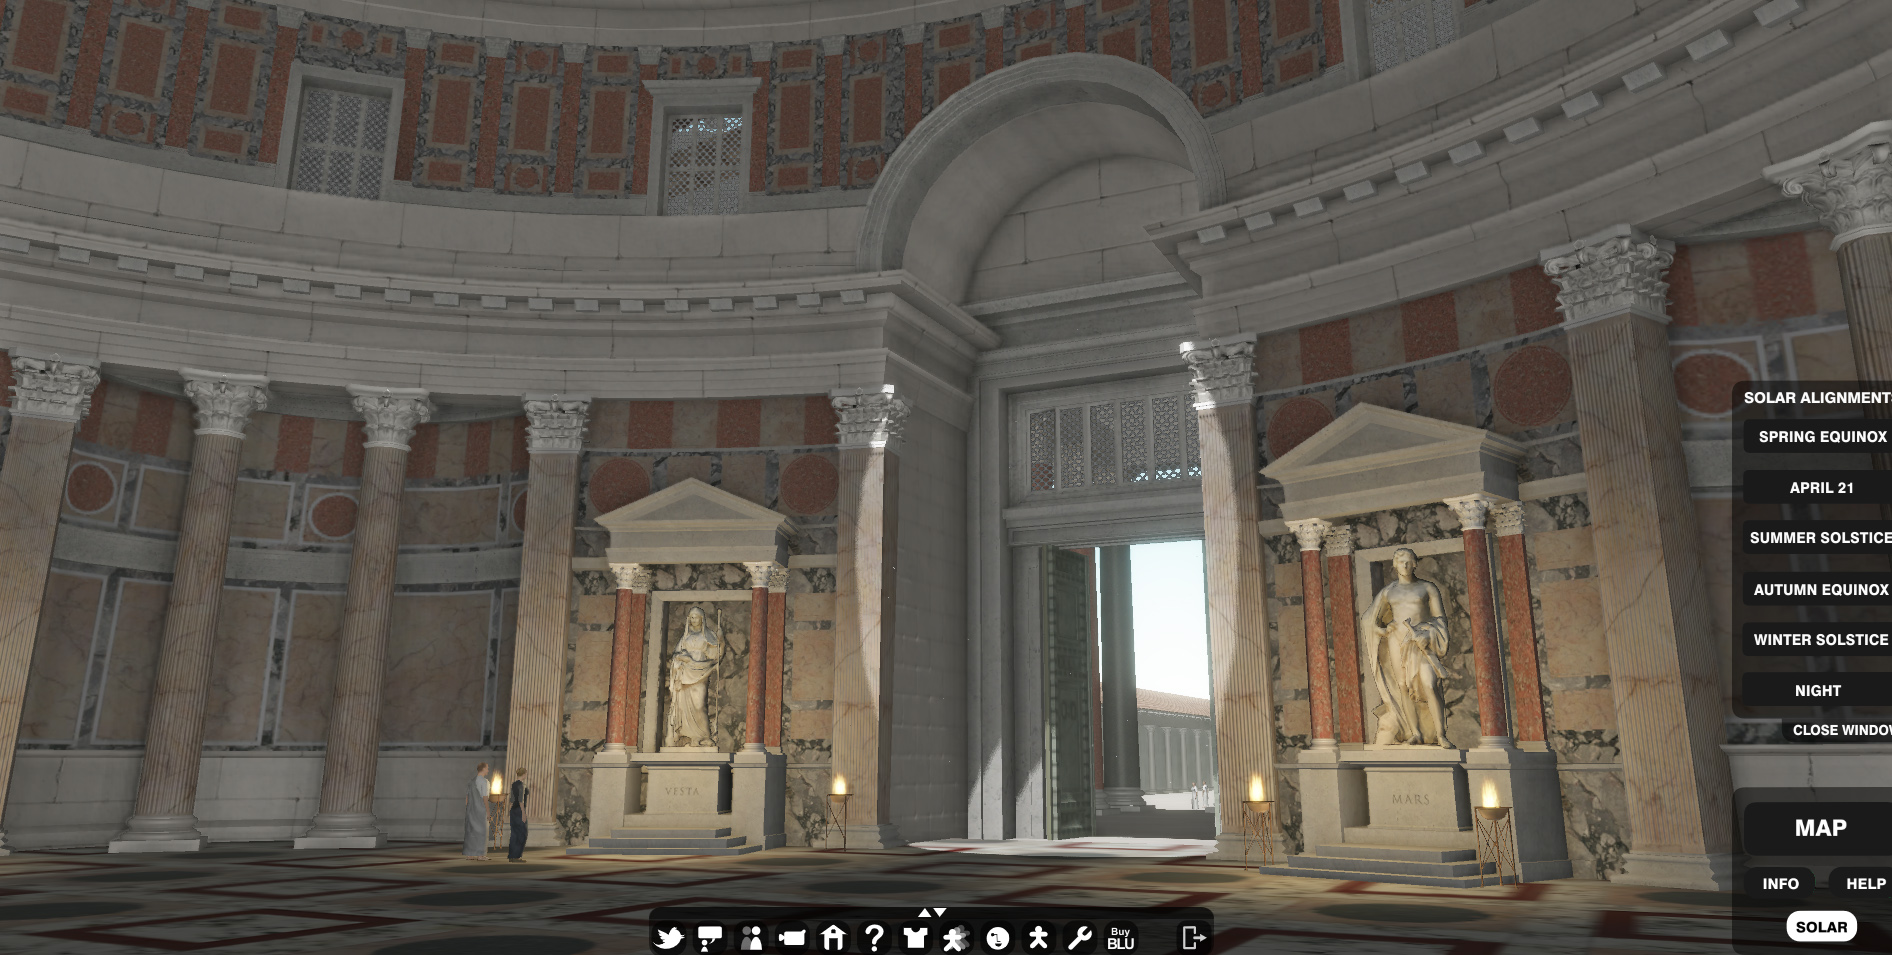
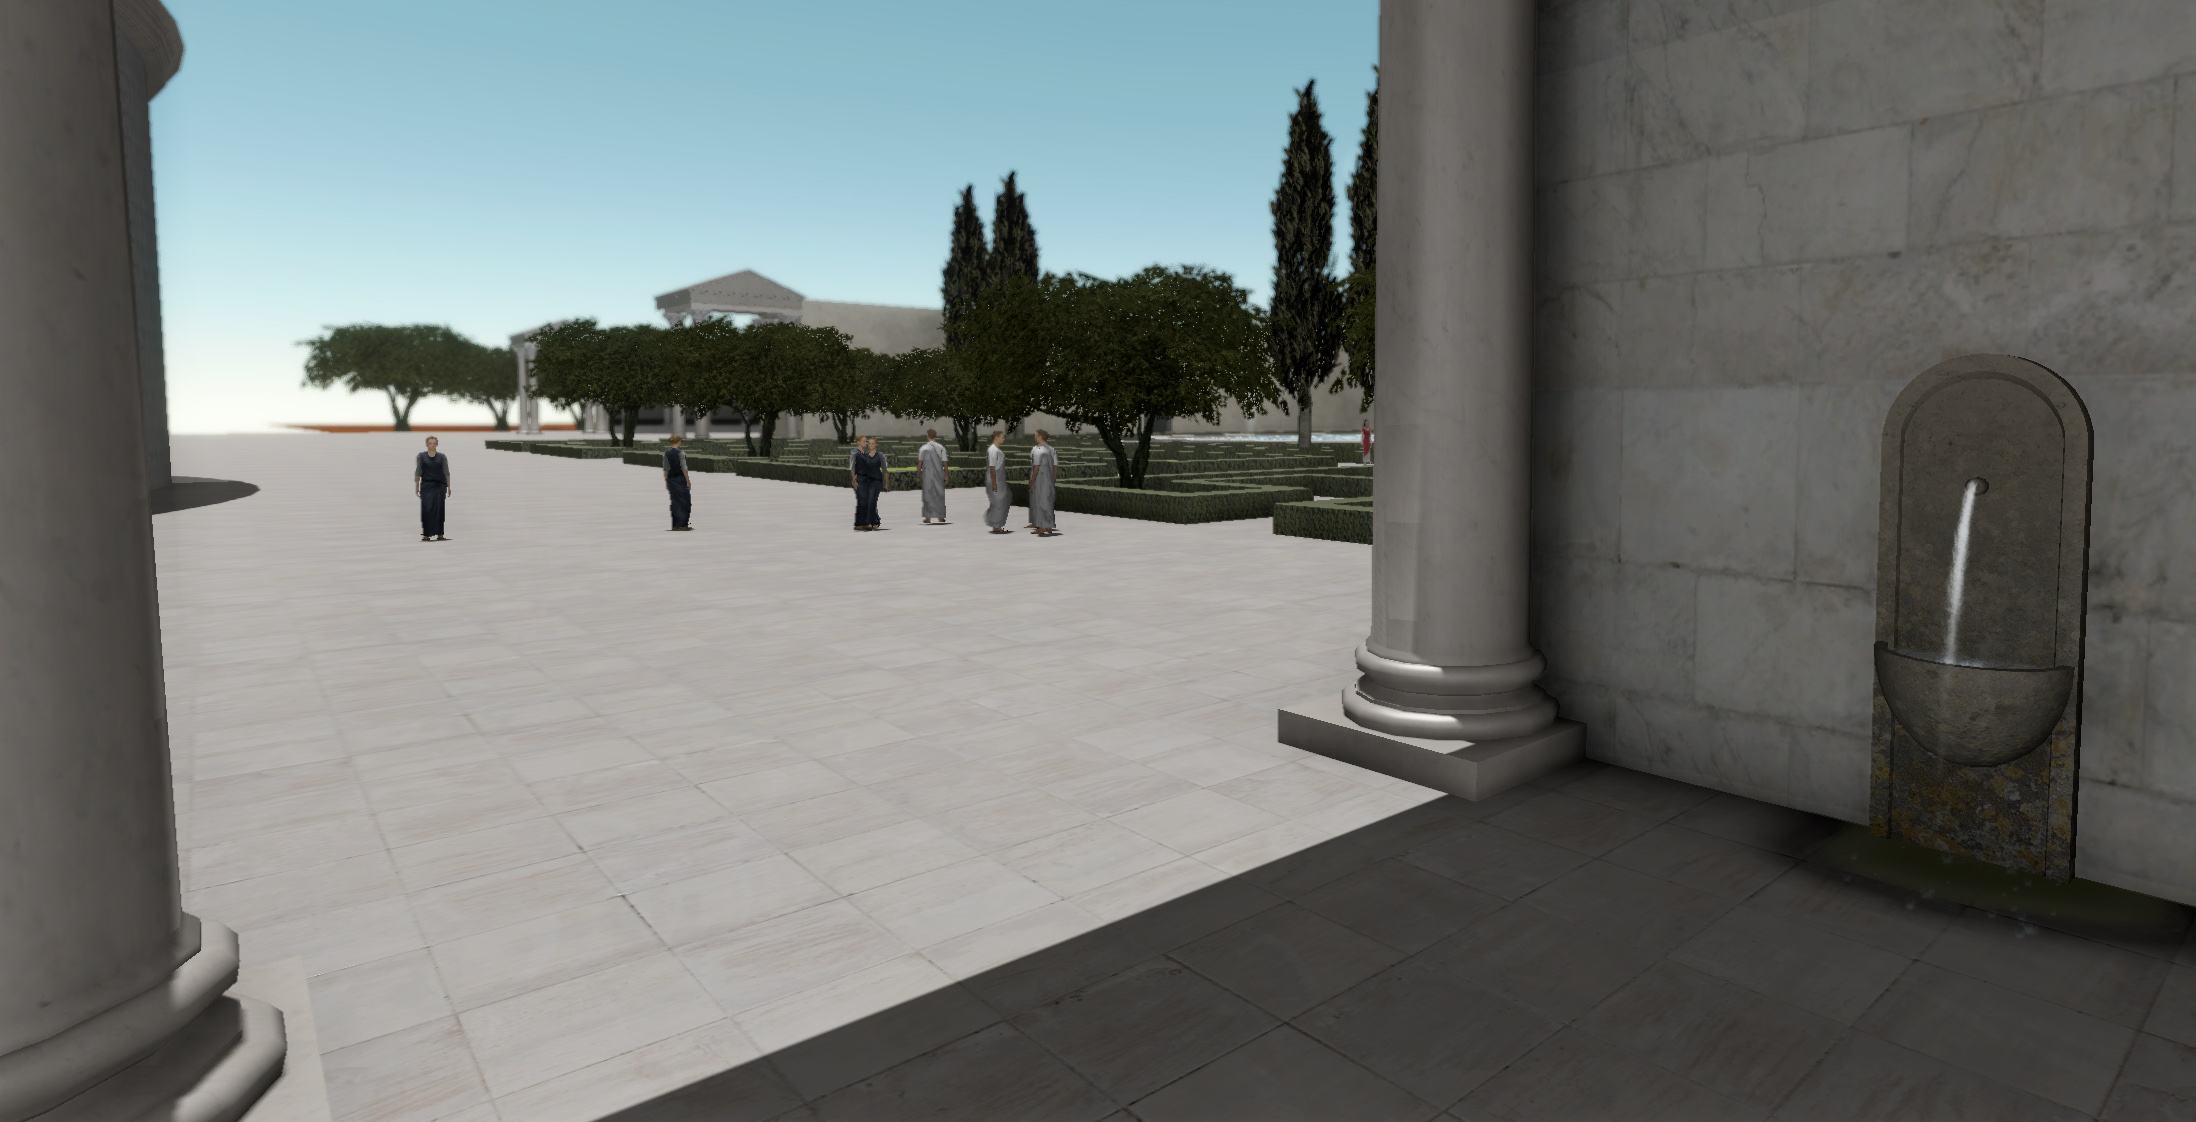
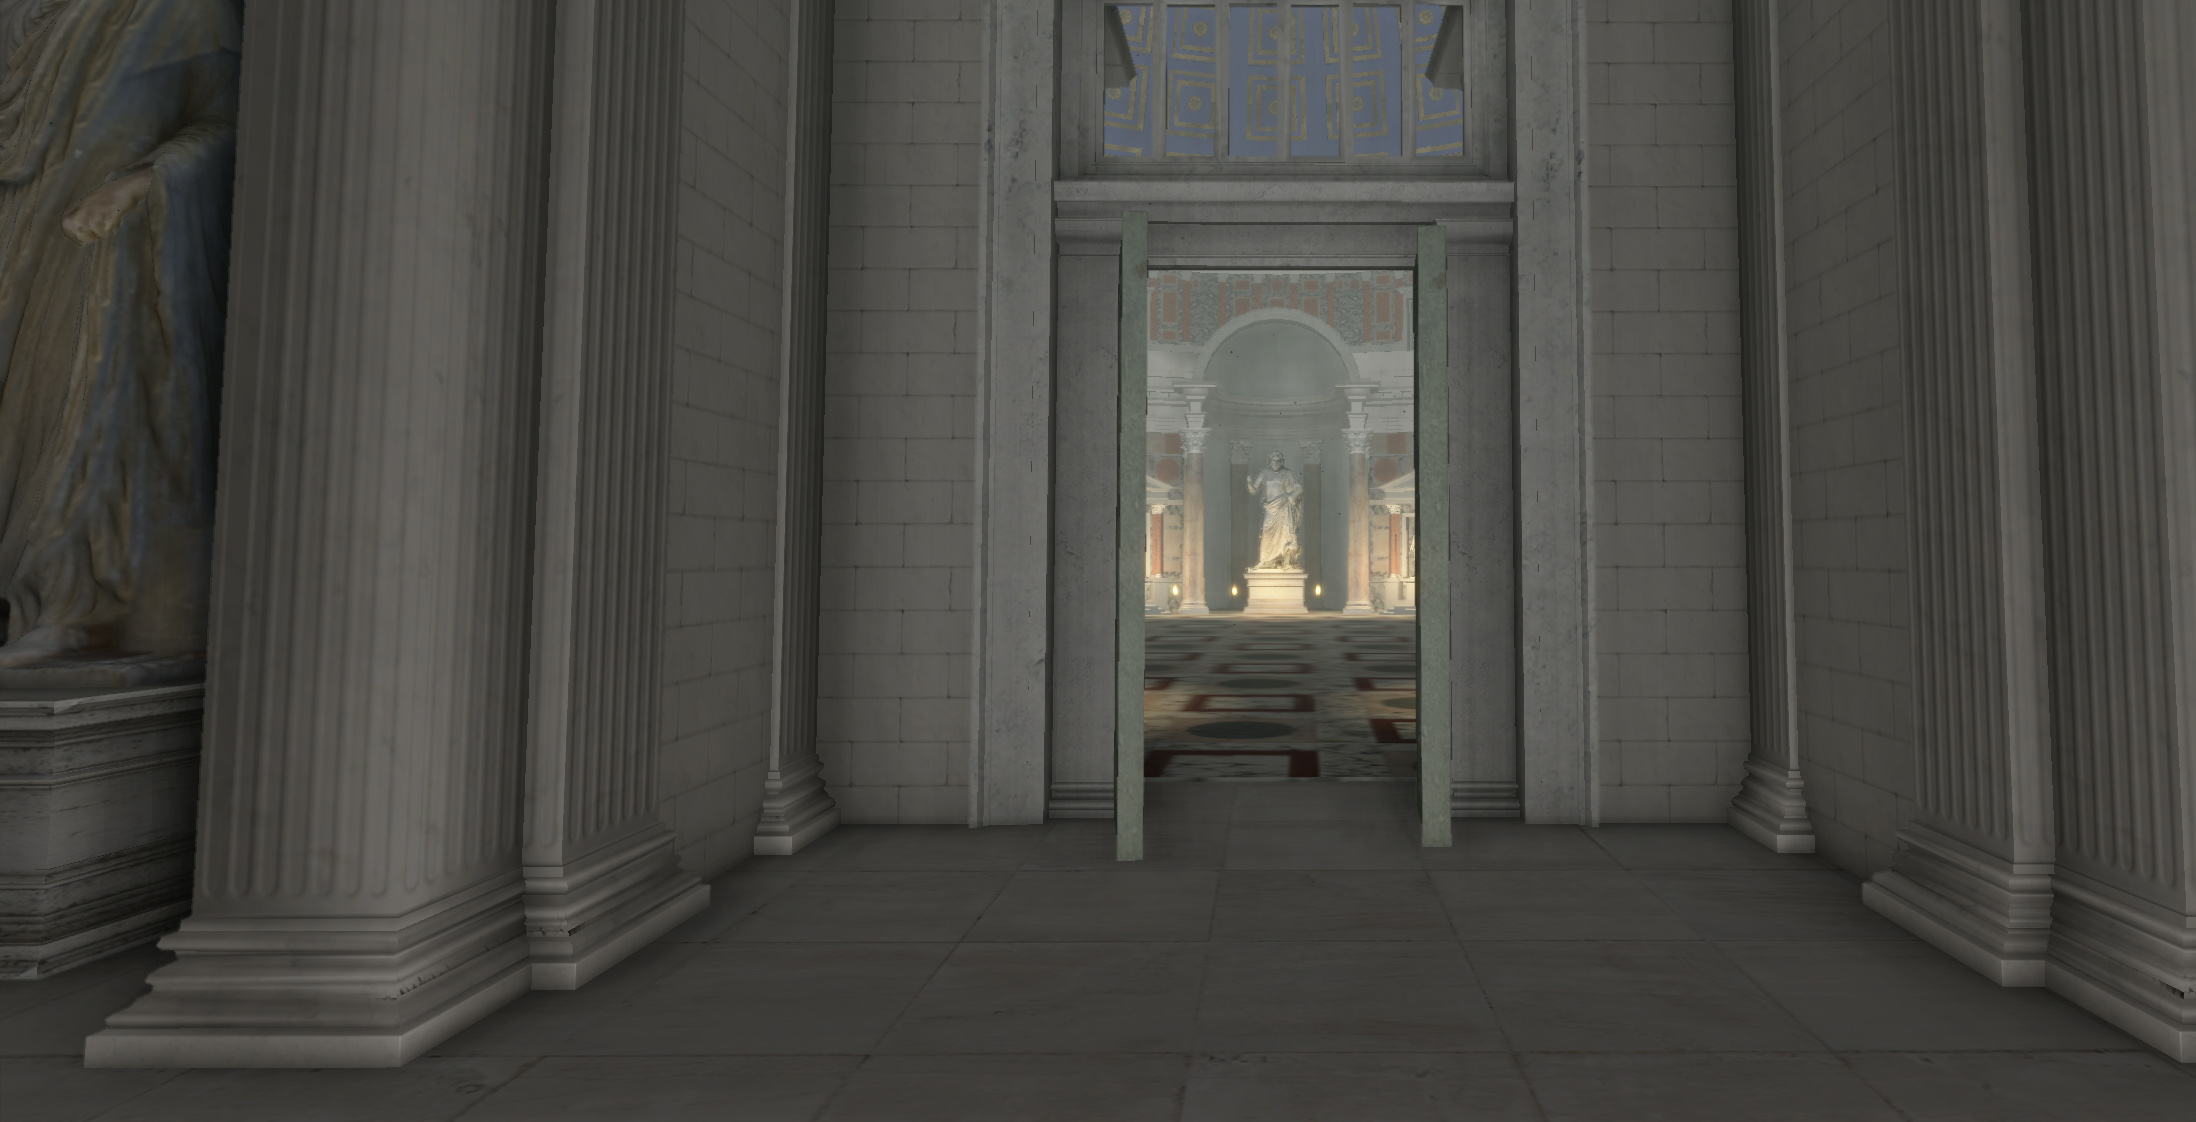
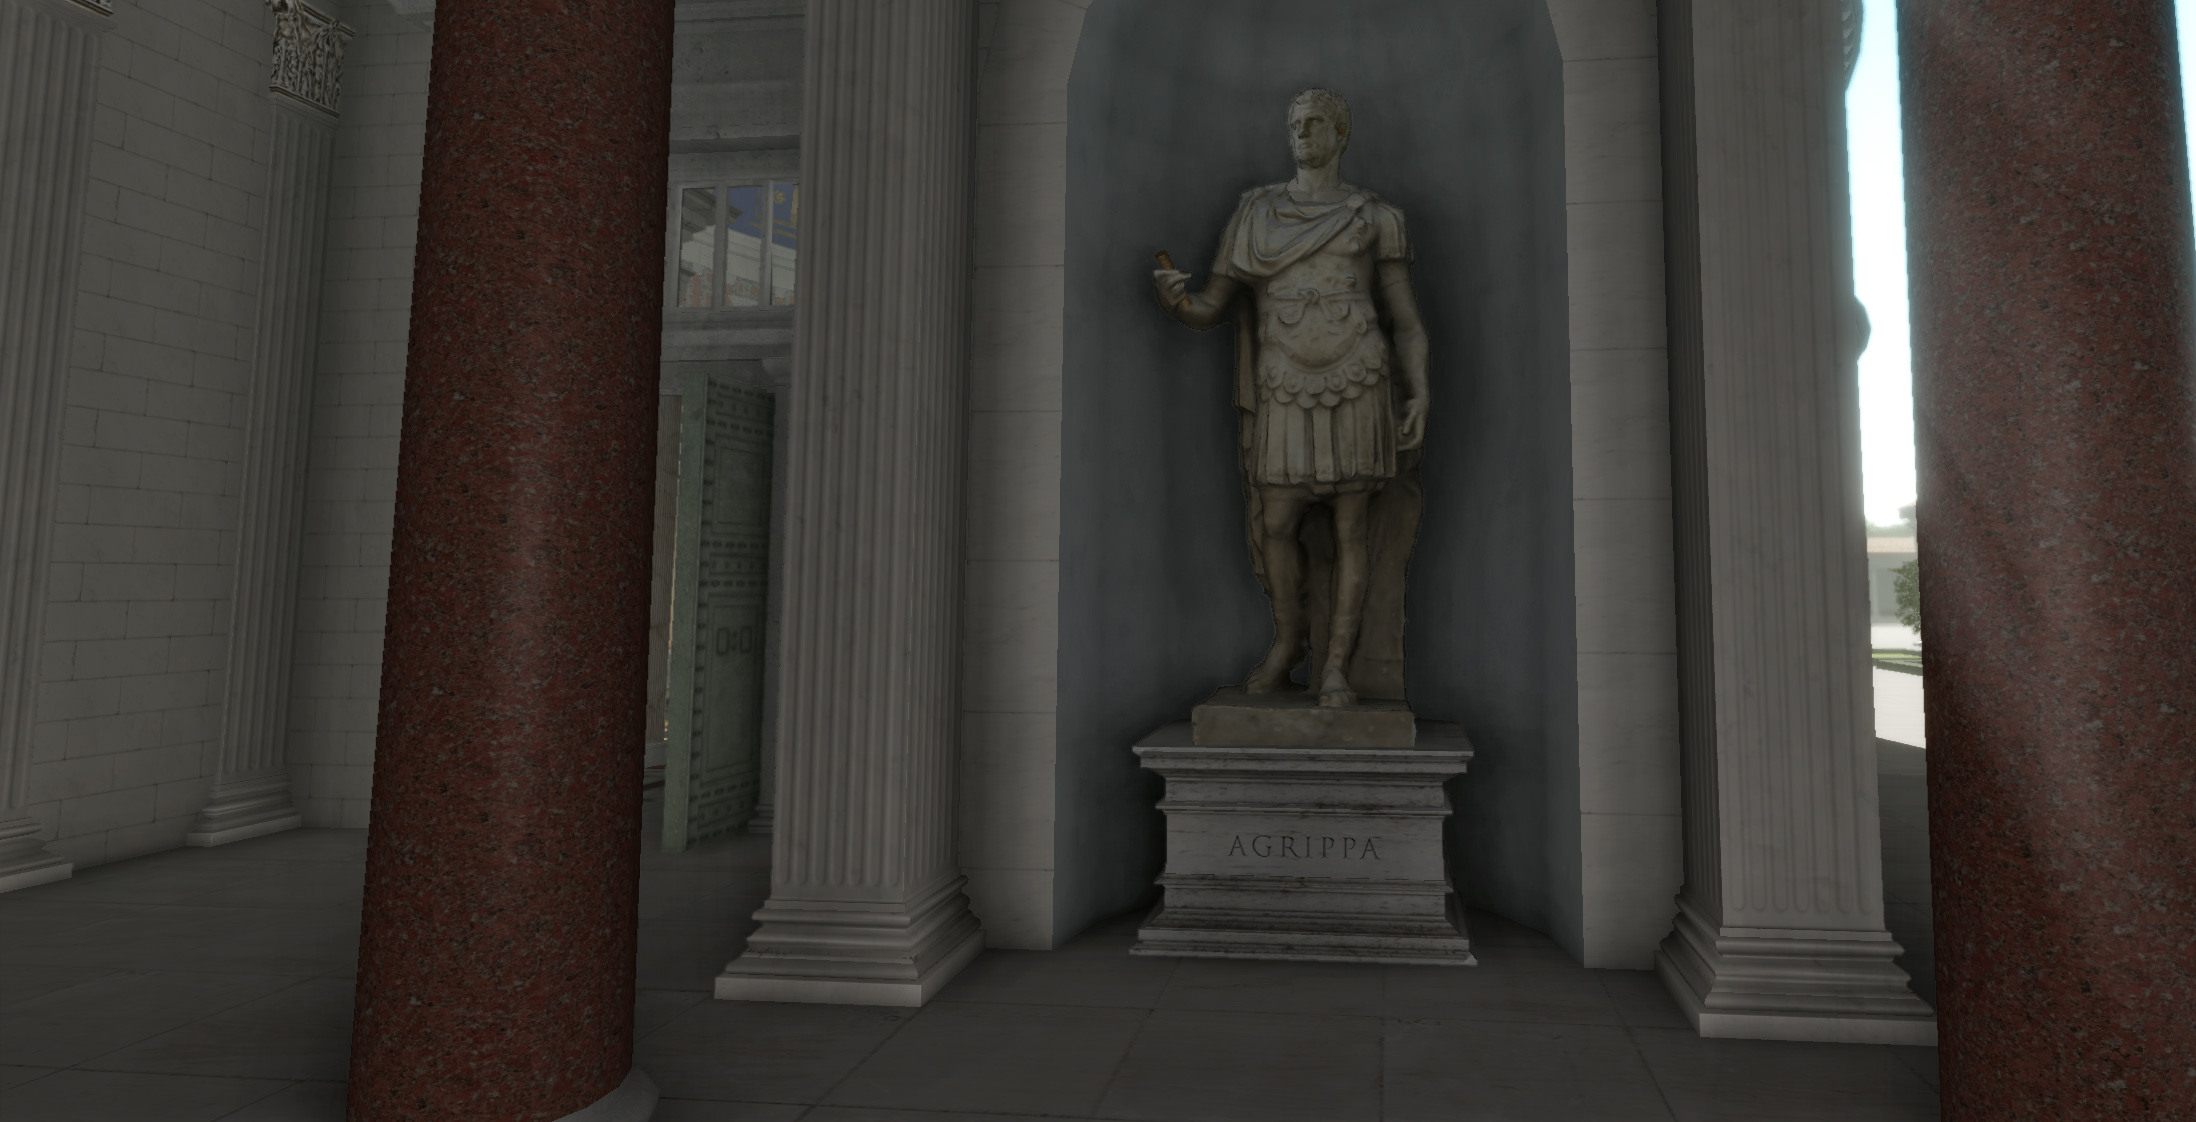
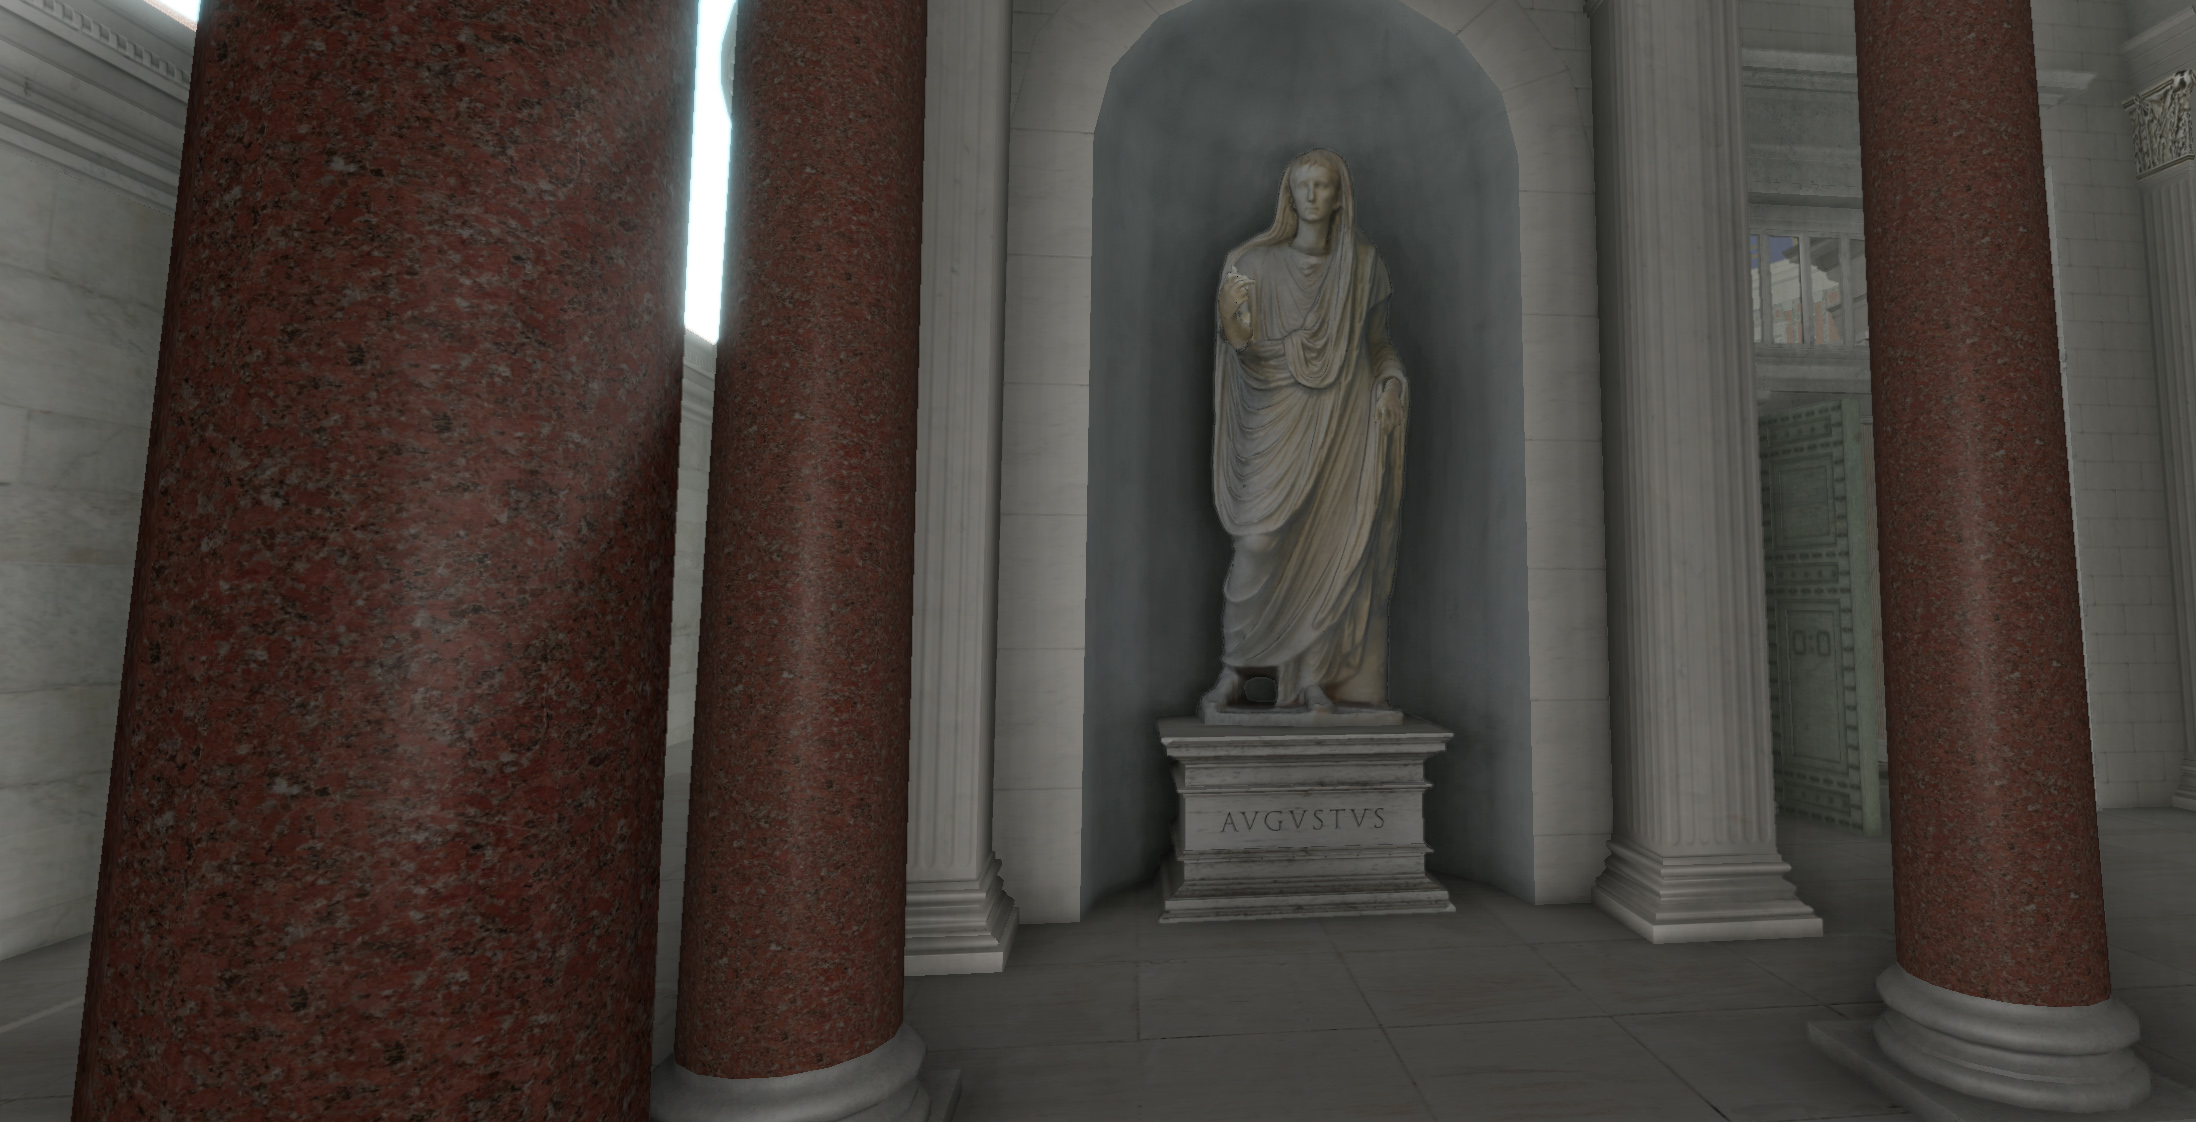
IDIA Lab has designed a virtual simulation of the villa of the Roman Emperor Hadrian, which is a UNESCO World Heritage site located outside of Rome in Tivoli, Italy. This project is being produced in collaboration with the Virtual World Heritage Laboratory (VWHL) at the University of Virginia (UVA), directed by Dr. Bernard Frischer and funded by the National Science Foundation. This large-scale recreation virtually interprets the entire villa complex in consultation with the world’s foremost villa scholars and educators. The project has been authored in the game engine of Unity as a live 3D multi-user online learning environment that allows students and visitors to immerse themselves in all aspects of the simulated villa.
The project will not only accurately recreate the villa buildings but also include a complete Roman avatar system, non-player characters with artificial intelligence, furniture, indigenous vegetation, dynamic atmospheric system and sophisticated user interface. The interface will not only provide learning, navigation, reporting and assessment opportunities but will also allow users to change the position of the sun to any date in 130 AD using data from the Horizons database at JPL NASA – testing theses of astro-alignments of architectural features during solstices and equinoxes. UVA students will be briefed on the culture and history of the villa as well as learn the virtual environment for five weeks prior to immersing themselves within it. The avatar system will allow for them to enter the world choosing class and gender – already being aware of the customs and behavior of the Roman aristocracy, soldier, slave or politician. This project will be delivered to VWHL at UVA in early March.
The Digital Hadrian’s Villa Project:
Virtual World Technology as an Aid to Finding Alignments between
Built and Celestial Features
Bernard Frischer1
John Fillwalk2
1Director, Virtual World Heritage Laboratory, University of Virginia
2Director, IDIA Lab, Ball State University
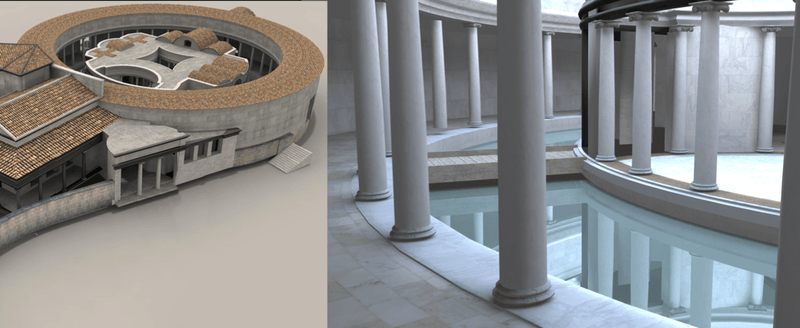
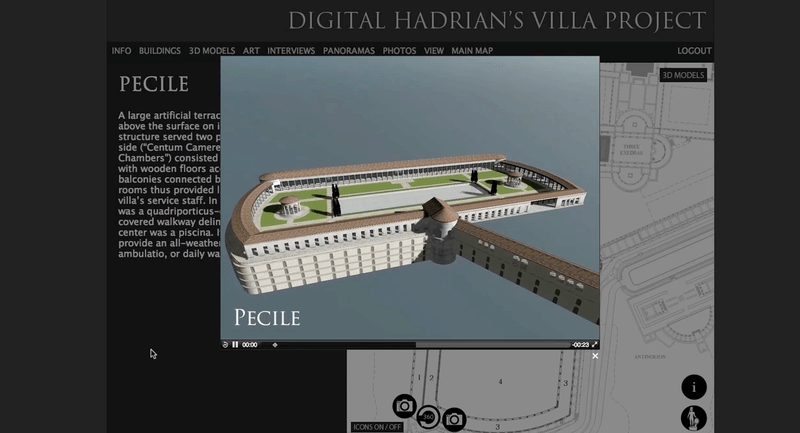
Hadrian’s Villa is the best known and best preserved of the imperial villas built in the hinterland of Rome by emperors such as Nero, Domitian, and Trajan during the first and second centuries CE. A World Heritage site, Hadrian’s Villa covers at least 120 hectares and consists of ca. 30 major building complexes. Hadrian built this government retreat about 20 miles east of Rome between 117, when he became emperor, and 138 CE, the year he died. The site has been explored since the 15th century and in recent decades has been the object of intense study, excavation, and conservation (for a survey of recent work, see Mari 2010).
From 2006 to 20011, with the generous support of the National Science Foundation[1] and a private sponsor, the Virtual World Heritage Laboratory created a 3D restoration model of the entire site authored in 3DS Max. From January to April 2012, Ball State University’s Institute for Digital Intermedia Arts (IDIA Lab) converted the 3D model to Unity 3D, a virtual world (VW) platform, so that it could be explored interactively, be populated by avatars of members of the imperial court, and could be published on the Internet along with a related 2D website that presents the documentation undergirding the 3D model.
The 3D restoration model and related VW were made in close collaboration with many of the scholars who have written the most recent studies on the villa.[2] Our goal was to ensure that all the main elements—from terrain, gardens, and buildings to furnishings and avatars—were evidence-based. Once finished, the was used in two research projects.
The first project was a NSF-sponsored study of the usefulness of VW technology in archaeological education and research. We used the virtual villa in undergraduate classes at Xavier University and the University of Virginia to investigate the thesis of two recent studies by project advisors Michael Ytterberg and Federica Chiappetta about how this enormous built space was used by six different groups of ancient Romans, ranging from the Emperor and Empress to normal citizens and slaves (Ytterberg 2005; Chiappetta 2008). Avatars representing these groups have been created and are being operated by undergraduate students as a Problem‐Based Learning (PBL) experience. They are observed by subject experts, who are using the data generated to test and, if necessary, refine the initial theses about how circulation through the villa was handled. The results are still being evaluated. Preliminary indications are that the data show that the combination of VW used in a PBL educational context is very effective in taking advantage of the known connection between between the hippocampus and long-term learning, especially when the information to be mastered is spatial (Kandel 2007).
The second project involved use of the VW for some new archaeoastronomical studies. Most of our advisors’ publications, like the older work by archaeologists that preceded them, have concentrated on archaeological documentation, restoration, formal, and functional analysis. The latest research by advisor De Franceschini and her collaborator Veneziano (2011) combined formal and functional analysis: it considered the alignment of certain important parts of the villa in relation to the sun’s apparent path through the sky on significant dates such as the solstices. In their recent book they showed how two features of the villa are aligned with the solar solstices: the Temple of Apollo in the Accademia; and the Roccabruna. We used the VW to extend their research to other areas of the villa, taking advantage of 3D technology to restore the sun to the right place in the sky and also to restore the damage to the architecture of the villa, as De Franceschini and Veneziano had independently suggested be done before they learned about our digital model of the villa.
The work of De Franceschini and Veneziano is innovative. Archaeastronomy has become an accepted field of study in recent decades, and a considerable amount of work has been done in Old and New World archaeology. In Roman archaeology, however, this approach is still rarely encountered. Significantly, one of the few compelling studies concerns the most famous Hadrianic building: the Pantheon in Rome. Hannah and Magli 2009 and Hannah 2011 have shown a number of solar alignments in the building, of which the most notable are the sun’s illumination of the entrance doorway at noon on April 21; and the view of sunset silhouetting the statue of Hadrian as Sun god on a four-horse chariot atop the Mausoleum of Hadrian as viewed from the middle of the Pantheon’s plaza at sunset on the summer solstice. Like the summer solstice, April 21 is also a significant date: on it occurred the annual festival in Rome known as the Parilia (re-named the Romaia by Hadrian),[3] which celebrated the founding of Rome.
De Franceschini and Veneziano pursued an observation of Mangurian and Ray (2008) to document an impressive example of solar alignment at Hadrian’s Villa involving the tower known as Roccabruna at the western end of the villa. Originally, a tower-like structure topped by a round temple, what remains today is the well-preserved, massive lower floor. The main entrance is located on the northwestern side to the right and gives access to a large circular hall covered by a dome. The dome is punctuated by an odd feature: five conduits that are wider on the outside than on the inside (figure 1).
What is the function of these unusual conduits? They have no known parallel in Roman architecture. After asking themselves this same question, on June 21st, 1988, the day of summer solstice, the American architects Robert Mangurian and Mary Ann Ray went to Roccabruna at sunset, and discovered the extraordinary light phenomena which occur there. At sunset the Sun enters through the main door illuminating the niche on the opposite side, something that happens during most of the summer days. But only in the days of the summer Solstice the Sun penetrates also into the conduit located above that door: its rays come out from the slot inside the dome projecting a rectangular light blade on the opposite side of the dome. In June 2009, De Franceschini verified the findings of Mangurian and Ray. However, they know that the apparent path of the Sun through the sky changes slightly each year, so that in the nearly 1880 years separating us from Hadrian, the precise effect of the alignment has been lost. As they noted, only a computer simulation can recreate the original experience of being in the lower sanctuary at Roccabruna at sunset on the summer solstice during the reign of Hadrian.
Once we had our 3D model of the site, we were able to obtain from NASA’s Horizons system[4] the correct azimuthal data for the year AD 130 and put the sun into the sky at sunset on the summer solstice. Following the lead of De Franceschini, who in the meantime had become a consultant to our project, we put into the niche one of the four statues of the Egyptian sky goddess Isis that were found at the Villa. De Franceschini chose Isis because first of all, there is no question there was a statue in this niche so we need to put something there; and the two flanking niches had candelabra, whose bases are preserved and are decorated with Isiac iconography. Moreover, Isis’ festival in Rome was on the summer solstice. So we scanned and digitally restored one of the several statues of Isis from the villa and put it into the central niche. Finally, for the dome, which we know from surviving paint was blue and therefore had the famous “dome of heaven” motif (Lehmann 1945), we followed De Franceschini in restoring a zodiac set up in such a way that the sign of Gemini is over the statue niche since the last day of Gemini is the summer solstice. Our zodiac is adapted from the great Sun God mosaic in the Rheinisches Landesmuseum in Bonn, which kindly gave us permission to use it.
As can be seen in figure 2, when we restored the sun in the right position in the sky dome for sunset on the summer solstice (June 21) of 130 CE in our 3DS Max model of Roccabruna, the sunlight coming through the main doorway illuminated the statue of Isis in the statue niche, and the light entering through the conduit lit up the sign of Gemini painted on the cupola. So we were able to confirm the Mangurian-Ray thesis.
The approach we have taken in our Roccabruna project is deductive: Mangurian and Ray noted the strange feature of the conduits punctuating the cupola of Roccabruna; they hypothesized a solar alignment. De Franceschini and Veneziano agreed and for various reasons we don’t need to go into today, they put a statue of Isis into the statue niche. We set up the conditions in which these hypotheses could be tested and were able to verify them.
But surely, if there is one such alignment at the villa of the same emperor who was responsible for the Pantheon, there may be others. But the villa is very big—covering over 100 hectares—and has 30 major building complexes, most larger than Roccabruna. Moreover, such alignments could just as easily involve astrological features such as the Moon and the planets. Faced with this level of complexity, the best methodological way forward in searching for new alignments is clearly inductive and empirical. This is one reason why we asked the Institute for Digital Intermedia Arts (IDIA Lab) of Ball State University to create a multi-user virtual world based in Unity 3D from our 3DS Max model.
The project of virtually interpreting a simulation on the scope and scale of Hadrian’s Villa was a daunting one – engaging layers of scholarly, technical and pedagogical challenges. The technical challenges were many – foremost to leverage the game engine of Unity 3D to become an effective multi-user avatar-based virtual world. An important factor was to create an environment that was straightforward and accessible via standard web browsers on both Mac and Windows and selected Unity 3D as the starting point for developing the platorm. We required specific back-end administration tools to handle the accounts and server side aspects of the project – for this we relied on Smart Fox Server as it manages Unity 3D quite well. Our team took an approach that bridged and integrated disparate technologies, creating a robust virtual world platform to immersively augment both instructional and PBL processes. VW features available to the learning community included text based communication, a live map showing current visitor positions, map based teleportation, managed voice channel, user selected avatar gestures, online users, paradata, photographs of the extant site, plan views, and integrated web links.
Key to the project was a varied system of avatars representing the imperial court, freemen, senators, scholars, soldiers, and slaves to the emperor. The avatar system provided several important functions testing recent scholarly interpretations of circulation throughout the villa and the use of various spaces for typical court activities – meals, imperial audiences, bathing, worship, etc. Upon entering the simulation, the choice of avatar would predicate how one’s social standing within the role-play of the world.
A gesture system was created via motion capture providing each user with a unique set of actions and gestural responses to engage social interactions – including greetings, bowing and gestures specific to rank and class. Communication was also a critical element in the modes of problem based learning engaged by the participants in the simulation. Specific technologies provided varied abilities such as public chat, private instant messaging and live multi-user voice channels.
A companion website was co-developed and integrated into the VW environment providing learners with visual assets such as photographs and panoramas of the current site, site plans, elevations, and video interviews with Villa scholars. We also developed three-dimensional turntables of the interpreted and reconstructed models, overview information on each of the major Villa features, bibliography and an expansive database of art attributed to the Villa site. This information can be directly accessed by learners directly from within the virtual world. The development team integrated the notion of paradata, introduced by the London Charter – making instantly transparent the scholarship and all underlying elements of the 3D model (from terrain to buildings, furnishing, costumes, and human behavior).
In support of new research theme on celestial alignments by consultants De Franceschini and Veneziano, a major goal for the project was to develop an accurate simulation for the position of the sun. The solar tracking, or virtual heliodon that we created as a response to this research, was envisioned as a simulation that would a bridge between the virtual environment and coordinates from an external database calculating solar positions. After investigating existing tools we decided to employ the Horizons database that was created by NASA’s Jet Propulsion Laboratory as an on-line solar system data computation service – tracking celestial bodies in ephemerides from 9999 BCE to 9999 CE. In implementing solar tracking for the Villa project in instances were we where we wanted to investigate potential significant solar alignments, we entered the latitude, longitude and altitudes of specific buildings from the Tivoli site to poll the Horizons data for the year 130 CE. The user was able to change the date, time of day, and quickly play the sun from specific moments via the user interface. The system was co-related to both the Julian and Gregorian calendars and contained presets for the vernal and autumnal equinoxes as well at the summer and winter solstices.
These tools allowed for the rapid discovery of potential alignment that might bear further investigation. The solar feature allows one to proceed empirically, in effect turning the clock back to 130 CE and running experiments in which the days and hours of the year are sped up by orders of magnitude so that one can in a very short time find candidate alignments not yet hypothesized by scholars working in the traditional way of Mangurian-Ray.
As developers, our goal was to create the solar tool and let students and scholars use it to undertake their own empirical research. Our team was not intending to engage in this research ourselves, yet in the process of working within the environment daily we quickly began to notice curious solar phenomena. In a bit of empirical study of the very first component of the site we installed in the simulation, the Antinoeion – or newly-discovered Temple of the Divine Antinous, we noticed an alignment of potential interest. The most likely alignment seemed at first glance to be along the main axis running from the entrance, through the obelisk in the central plaza to the statue niche at the end of the axis. We ran the days and hours of the year and found that the sun and shadow of the obelisk align at sunrise on July 20. We consulted with our expert on the Egyptian calendar in the Roman period, Professor Christian Leitz of the University of Tuebingen–and he confirmed that this date has religious significance. It is, in fact, the date of the Egyptian New Year, as the Romans of Hadrian’s age clearly knew (cf. the Roman writer Censorinus, who states that the Egyptian New Year’s Day fell on July 20 in the Julian Calendar in 139 CE, which was a heliacal rising of Sirius in Egypt).
In the process of developing and subsequently utilizing the simulation tools we created for astro-archeological research, our conclusions have been that virtual world technologies can indeed take the inquiry for significant built-celestial alignments to a new level of insight.
Bibliography
Chiappetta, F. 2008. I percorsi antichi di Villa Adriana (Rome).
De Franceschini, M. and G. Veneziano, 2011. Villa Adriana. Architettura celeste. Gli secreti degli solstizi (Rome).
Hannah, R. 2008. Time in Antiquity (London).
Hannah, R. 2011. “The Role of the Sun in the Pantheon’s Design and Meaning,” Numen 58: 486-513.
Kandel, E. 2007. In Search of Memory: The Emergency of a New Science of Mind (W. W. Norton, New York). Kindler edition.
Lehmann, K. “The Dome of Heaven,” Art Bulletin 27: 1-27.
Lugli, G. 1940. “La Roccabruna di Villa Adriana,” Palladio, 4: 257-274
Mangurian, R. and M.A. Ray. 2008. “Re-drawing Hadrian’s Villa,” Yale Architectural Journal, 113-116.
Mari, Z. 2010. “Villa Adriana. Recenti scoperte e stato della ricerca,” Ephemeris Napocensis 20: 7-37.
Ytterberg, M. 2005. “The Perambulations of Hadrian. A Walk through Hadrian’s Villa,” Ph.D. dissertation, University of Pennsylvania.
Linden Lab lifted the veil on Sansar, the long awaited followup to Second Life, allowing the general public to explore VR environments that beta-testers have been creating for the platform. Among the usual suspects of ritzy nightclubs and elven cities is something unexpected.
Over the summer, a group of digital artists from Ball State University used Sansar to construct a digital replica of Newton’s Cenotaph—one of the most awe-inspiring neoclassical structures to never have been built.
“The building is really at this preposterous and fantastical scale,” director at Ball State’s IDIA Lab John Fillwalk told me in a phone interview. IDIA Lab is a division within Ball State’s College of Architecture and Planning that explores the intersection of digital and physical design.
“With this technology, you can build the impossible, or at least the impractical,” said Fillwalk. It had been a long-time aspiration of his to digitally assemble Newton’s Cenotaph in some shape or form, and Sansar provided a convenient way to bring the unrealized work of architecture to life.
The Cenotaph is a great, big dome of a building, originally imagined by the French architect Étienne-Louis Boullée in the 18th century. But Boullée’s more grandiose designs tended to skirt the limits of feasibility, and thus rarely saw the light of day. The Cenotaph’s design, for instance, eclipses the height of the Great Pyramids at 455 feet.
“It would take an enormous amount of labor to do something like that in reality,” Fillwalk said. “And the engineering to pull it off would be an outstanding undertaking.”
Sansar made it easier. To begin with, Fillwalk got ahold of high resolution scans from Boullée’s architectural prints. Following them as closely as possibly, the group recreated them in 3D modeling software Maya.
While the exterior of the unbuilt building is expansive, the interior is mechanically intricate. Boullée envisioned the building as a monument to Isaac Newton, who among other things, worked out mathematical proofs for heliocentrism, the idea that planets orbit around the sun.
In tribute, a great brass armillary sphere, representing the motion of the planets, was intended to rotate within the equally great dome.
One of VR’s greatest assets is giving users a sense of scale, so the medium was a natural fit for resurrecting impossible works of overambitious architecture, Fillwalk said. In fact, the Cenotaph may be too big.
“Because it takes so long to walk through it normally, we put in a teleport feature as a speedy way to get through it,” he said.
Virtual Antinoeion, is a virtual reality application designed by the IDIA Lab at Ball State University. This temple, located at the UNESCO World Heritage Site of Hadrian’s Villa, was a sacred temple dedicated to Antinous, the beloved companion of Emperor Hadrian, who drowned in the Nile in 130 CE. This monument underscores the deep personal and political significance of Antinous’ deification, as Hadrian elevated him to divine status and promoted his cult across the Roman Empire. Architecturally, the Antinoeion reflected Hadrian’s fascination with Egyptian and Greek culture, incorporating classical Hellenistic and Egyptianized elements to emphasize Antinous’ association with youthful beauty. As part of the vast villa complex at Tivoli, the Antinoeion functioned as a place of mourning and worship as a symbol of his imperial power, reinforcing Hadrian’s vision of a cosmopolitan and culturally integrated empire. Its presence within the villa highlights the emperor’s personal grief, as well as the broader religious and artistic currents of the period.
Experience Arabic Heritage is an immersive virtual reality tour recreating several UNESCO World Heritage sites in the Middle East. The project includes virtual experiences of the Tomb of Lihyan, located at Hegra, in Saudi Arabia, featuring monumental tombs with carved facades dating from the 1st century BC to the 1st century AD; the oasis of Al-Ahsa, also in Saudi Arabia, bearing witness to human settlement in the Gulf region from the Neolithic era to the present day; and the Al Zubarah Fort, part of an ancient trading port, it is Qatar’s largest heritage site.
Virtual Monument Circle is a mobile application that uses historic photographs and maps of downtown Indianapolis, IN to create an immersive interpretation of various historic phases of the city center. This project is a prototype for a larger potential city-wide endeavor bringing to life significant neighborhoods and sites within the city. It is developed as a possible collaboration between the Institute for Digital Intermedia Arts at Ball State University, the Polis Center at Indiana University Purdue University Indianapolis and the Indiana Historical Society.
There are two experiences with the content dependent on the proximity of the user’s location – onsite and offsite. It will be available soon for both iOS and Android.
Virtual Monument Circle was designed and produced by the Institute for Digital Intermedia Arts at Ball State University. Special thanks to the Polis Center at IUPUI and the Indiana Historical Society.
IDIA Lab – in collaboration with BSU Assistant Professor of Architecture, Kristin Barry – has designed the cultural heritage mobile application, Virtual Columbus Experience – allowing users to virtually tour the rich architectural history of Columbus, Indiana. This locative mobile app was produced with fellowship support of Ball State University’s Digital Scholarship Lab.
Though a relatively small city, Columbus has made itself a cradle of modern architecture, commissioning many buildings and public works since the middle of the 20th century. The number of landmark buildings and notable architects to have worked in the city has earned it the nickname “Athens on the Prairie.”
With data and artifacts gathered by Kristin Barry’s immersive class, users of the app can explore 3D models of key buildings commissioned over the years, survey timelines showing when architects were active or buildings were constructed, and meet Columbus’ famous architects – such as Eero Saarinen, I.M. Pei, and Harry Weese.
After its launch, Virtual Columbus Experience will seek further funding to expand the scope and depth of the project across the community.
Panama-Pacific International Exposition Simulation
IDIA simulation of the 1915 San Francisco Panama – Pacific Exposition The project allows for visitors to travel to the past to immersively tour a recreation of an historic environment that no longer exists. The exposition celebrated the opening of the Panama Canal but also San Francisco’s recovery from the devastating earthquake of 1906. IDIA 3D laser-scanned two sculptures by artist Adolph Weinman that have been included in this simulation and were originally installed on top of tall columns in the Court of the Universe. A more detailed examination of the sculptures can be found in our Museum Simulator. Visitors can change the time of day near controls found near this sign and the Fine Arts Palace to experience the lighting design of this exposition.
Palace of Fine Arts
The Palace of Fine Arts in the Marina District of San Francisco, California was originally constructed for the 1915 Panama-Pacific Exposition. One of a handful of surviving structures from the Exposition, it is the still situated on its original site. It was rebuilt in 1965 – and renovation of the lagoon, walkways, and a seismic retrofit were completed in early 2009. IDIA Lab constructed this as an addition to its Panama- Pacific Court of the Universe simulation.
IDIA Lab has created a virtual simulation of the Wright Brothers bicycle shop in Dayton, OH for the HTC Vive headset and SteamVR. The environment is a recreation of the Wright Cycle Company, on South Williams Street in Dayton was built in 1886 and is a US National Historic Landmark and on the National Register of Historic Places. The Wrights occupied this location from 1895-1897. IDIA Lab designed the experience as a virtual field trip where a visitor can pick up and examine highly detailed objects from the shop including letters, tools and inventions created by the Wrights. This project will be published on Steam VR in the coming months.
Ball State’sApplied Anthropology Laboratories (AAL) and the Institute for Digital Intermedia Arts (IDIA Lab) are creating a web-based virtual world that interprets the earthworks in their era of construction. The project is led oy Kevin Nolan, director and senior archaeologist at AAL and project co-director John Fillwalk, senior director ofIDIA Lab.Interactive features will include accurate celestial alignments. The sky will be simulated with accurate celestial bodies using data from NASA’s Jet Propulsion Laboratory to allow users to view the stars, planets, moon, and sun as they appeared 2000 years ago.
Already a National Historic Landmark, Ohio designated the Newark Earthworks as “the official prehistoric monument of the state” in 2006. Spread across four miles in what is now present-day Newark, Ohio, mounds and walls are constructed to record significant celestial alignments on the landscape, including the 18.6-year lunar cycle. The earthworks created community for the Hopewell People and provided sacred spaces for religious rituals and ceremonies related to their society. The Newark Earthworks comprise the largest set of geometric earthen enclosures in the world, built by the Hopewell People between A.D. 1 to A.D. 400 to serve a variety of cultural and spiritual purposes.
The project is a collaboration between Ball State and the Ohio History Connection, with support and partnership from several federally recognized American Indian tribes, including the Eastern Shawnee Tribe of Oklahoma and the Shawnee Tribe.
Learn how modern technology can shape our understanding of the past during a special program at Mounds State Park on Saturday, Nov. 14.
Visitors to the 1 p.m. program will join park naturalist Kelley Morgan to learn about modern technologies that help archaeologists and historians bring the past to life. During the second half, director John Fillwalk and animator Neil Zehr of the Institute for Digital Intermedia Arts Laboratory at Ball State University will demonstrate how they use archaeological data to interpret the past to the public.
A person holds a tablet in front of an outdoor information sign, using the device to display augmented reality content over a grassy mound.
Map interface of Virtual Adena Mounds showing several earthworks, marked colored dots, and a menu with map view options including Satellite, Park Map, Overlay, Contour, and 3D Map.
A virtual interface displays information about the Great Mound, including a diagram, text on celestial observations, and navigation buttons over a satellite map background.
Aerial view of a large grassy landscape with geometric shapes and raised earth patterns, surrounded by dense trees in the background.
BSU’s IDIA Lab is premiering Virtual Companion – their custom augmented reality app employing LocusEngine, a geolocative process developed by IDIA Lab. Visitors to the park use the app to aid in learning and discovery while exploring the park’s Adena-Hopewell mounds. Using GPS data, the user’s position is geolocated in reference to the historical sites, allowing the app to display relevant content as a dynamic guide. This approach can be applied in cultural heritage, archeology, the sciences and the arts.
Interactive features, as well as the user’s current location in the park, are marked on a series of map options designed to provide multiple layers of locative information throughout the park. A GPS-driven trail map is available, allowing the user to track their movement through the trails and important features. When an interactive feature is selected on the map, an augmented reality view using gyroscope and compass data is loaded, portraying native people’s and habitats from the Adena-Hopewell era. Archaeologists have proposed that the enclosures were used to track celestial alignments. Using solar data from NASA’s JPL Horizons database, the movements of the sun on the equinoxes and solstices during the Adena-Hopewell era can be viewed and tracked to search for important alignments.
Standard park entry fees of $5 per in-state vehicle apply. Mounds State Park (stateparks.IN.gov/2977.htm) is at 4306 Mounds Road, Anderson, 46017.
Ball State University’s IDIA Lab https://idialab.org is developing a multiplayer virtual world that simulates Buffalo Bill Wild West Show. This digital history project is built in Unity 3D using custom software created by IDIA Lab and is being produced for the Buffalo Bill Center for the West in Cody, WY. Scholars include Douglas Seefeldt and James Connolly at Ball State University. http://centerofthewest.org
IDIA Lab was contracted by digital humanities scholars at UCLA to design and build a virtual simulation of the Temple of Artemis, one of the Wonders of the Ancient World, This massive Greek temple, four times the size of the Parthenon lies in ruin in present-day Turkey. This simulation incorporates our CelestialEngine with accurately positions both the sun and moon using a site’s latitude, longitude, altitude and year via NASA JPL data. This particular simulation studies whether an opening in the temple’s portico allowed moonlight to illuminate the statue of Artemis on her feast day.
Digital reconstruction of the Temple of Artemis with user interface elements for entering date, time, and year, plus play controls and navigation buttons at the bottom.
Digital reconstruction of the Temple of Artemis with input fields for date and time, showing the ancient structure’s columns and roof under daylight.
White text on a black background reads CHICHEN ITZA DEMO.
Screenshot of a virtual simulation of Chichen Itza, showing a large stone wall under a cloudy sky, with navigation and information menus visible at the top.
Screenshot of a virtual simulation of Chichen Itza, featuring a central pyramid, grassy area, and interface elements from Ball State University’s Institute for Digital Intermedia Arts.
Screenshot of the Virtual Chichen Itza simulation menu, showing game instructions, credits, and a digital recreation of ancient stone walls under a blue sky.
The Pantheon is the best-preserved architectural monument of ancient Rome. This simulation by BSU’s IDIA Lab represents the Pantheon and its surrounds as it may have appeared in 320 AD. Visitors to this simulation can tour the vicinity, learning about the history, function and solar alignments through an interactive heads up display created for this project. The project opened in beta in late 2013 and will premiere publicly in February 2014 and includes new solar simulation software calibrated to the buildings location and year, an interactive HUD, a greeter bot system and a new AI Non Player Character system developed in partnership between IDIA Lab and Avatar Reality.
Originally built by Agrippa around 27 BC under the rule of Augustus, it was destroyed by fire, then rebuilt and finally completed in its present form during Emperor Hadrian’s reign, around 128 AD. Agrippa finished the construction of the building and it bears his name above the portico. The Pantheon would have contained numerous marble statues representing the major Roman deities. The statues displayed in this simulation represent a possible configuration and are scanned via photogrammetry. The buildings surrounding the Pantheon are built and interpreted by IDIA based on the large scale model of ancient Rome built by Italo Gismondi between 1935 and 1971. The model resides in the Museo della Civiltà Romana, just outside of Rome, Italy.
Video walkthrough of the Virtual Pantheon:
A group of people gathers in front of a grand Roman-style temple at night, with colonnades and a large domed building visible in the background.
Four people in ancient-style robes stand talking near stone steps in a courtyard with columns and a stone wall in the background.
People stand and walk in an open courtyard with classical Roman architecture, including columns and a large domed building, under a clear sky.
A grand circular hall with marble floors, large columns, statues in alcoves, and burning torches; people are standing near the walls.
Interior view of a domed ceiling with geometric patterns, showing a central oculus and sunlight streaming onto the wall and arches below.
Interior view of a domed ceiling with decorative square panels, a circular opening at the top, and sunlight streaming through. A row of columns lines the wall below.
Interior of a grand rotunda with marble statues in niches, large columns, detailed walls, and a central open doorway; user interface elements visible at the bottom.
Interior of a grand marble rotunda with tall columns, statues in alcoves, large arched doorway, and ornate detailing on the walls and ceiling.
Interior view of a grand rotunda with marble columns and statues in alcoves, natural light entering through a large, open doorway.
Interior view of a grand, circular marble hall with classical statues in alcoves, tall columns, and an open doorway letting in natural light.
A marble statue labeled Vesta stands in an ornate alcove with red columns and lit torches. Two people observe the statue from a short distance.
A marble statue labeled VENVS stands between two red marble columns in an ornate, domed room with marble walls and two lit torches on either side.
A group of people stand in front of a large statue labeled VULCANVS inside a marble-walled, columned chamber with lit torches.
A marble statue labeled Minerva stands under a stone canopy with red columns, flanked by tall pillars and lit by two small torches in a grand hall.
Large marble statues of Diana, Jupiter, and Minerva are displayed in an ornate hall with tall columns and torches. A person stands in front of the central Jupiter statue.
A marble statue labeled Diana stands between two red marble columns on a pedestal in a grand hall with marble walls and floors, flanked by two burning torches.
A marble statue labeled IVNO stands on a pedestal between two red columns, flanked by two lit torches, inside a circular, ornate stone room.
A marble statue labeled CERES stands between two columns in an ornate, torch-lit hall with two people visible in the foreground.
A marble statue of Mars stands on a pedestal between two red columns, with two fire torches on either side, inside a classical building with marble floors and walls.
A large, ornate hall with marble columns, statues, intricate floor patterns, and a domed ceiling; a few people stand and walk inside.
Interior of a grand domed hall with marble columns, patterned floor, statues, and ornate wall decorations, illuminated by lamps.
A stone wall fountain with water flowing from a spout into a basin, with some moss and water stains on the base, set against a marble wall.
A digital reconstruction of an ancient Roman street scene with people in togas, horses, carts, and stone buildings with columns.
A digital rendering of an ancient Roman square featuring a triumphal arch, a domed building with columns, and small figures walking or standing in the plaza.
People in ancient Roman-style clothing walk in a large open courtyard surrounded by colonnades, with a triumphal arch in the background under a clear sky.
A wide stone courtyard lined with tall columns on both sides, scattered groups of people walking and standing under a clear blue sky.
A stone courtyard with a few people standing in groups, trees, and a distant classical-style building; a fountain is mounted on a nearby wall.
View through tall doorway into a grand hall with columns, checkered floor, statues, and illuminated architectural details in the background.
Statue of a man in Roman armor stands on a pedestal labeled AGRIPPA between two large columns in a classical architectural setting.
A marble statue of a robed figure stands in an alcove behind red and white columns, with AVGVSTVS inscribed on the pedestal.
A group of people in togas walk in front of a large ancient Roman temple with columns and a triangular pediment.
The Solar Alignment Simulation of the Roman Pantheon was developed under consultation with archeo-astronomer Dr. Robert Hannah, Dean of Arts and Social Sciences at the University of Waikato, New Zealand, one of the world’s foremost scholars on Pantheon solar alignments; and archaeologist Dr. Bernard Frischer, Indiana University.
Background
The Pantheon that we can visit today is composed of a rectangular porch with three rows of granite columns in front of a circular building designed as a huge hemispherical dome (142 feet in diameter), built over a cylinder of the same diameter and as high as the radius. Therefore, the ideal completion of the upper hemisphere by a hypothetical lower one touches the central point of the floor, directly under the unique source of natural light of the building. This light source is the so-called oculus, a circular opening over 27 feet wide on the top of the cupola. It is the only source of direct light since no direct sunlight can enter from the door in the course of the whole year, owing to the northward orientation of the entrance doorway. Of the original embellishments the building should have had, the coffered ceiling, part of the marble interiors, the bronze grille over the entrance and the great bronze doors have survived.
Interior Wall
The interior wall, although circular in plan, is organized into sixteen regularly spaced sectors: the northernmost one contains the entrance door, and then (proceeding in a clockwise direction) pedimented niches and columned recesses alternate with each other. Corresponding to this ground level sector are fourteen blind windows in the upper, attic course, just below the offset between the cylinder and the dome. It is likely that both the niches and the windows were meant for statues, which, however, have not survived.
Oculus
Direct sunlight penetrates the interior only through a large, 27 foot wide oculus in the center of the domed roof. Otherwise indirect sunlight can enter the building, but only through the large, north-facing doorway, when it is open. The fall of direct sunlight through the oculus into the essentially spherical building leads to the comparison with a roofed sundial.
Celestial Alignments
A columned porch leads through a vestibule of the Pantheon, into a huge, shadowy interior, over 142 feet in height and as much in diameter. The building’s form is essentially that of a sphere with its lower half transformed into a cylinder of the same radius. Direct sunlight penetrates the interior only through a large, 27 feet wide oculus in the centre of the domed roof.
The shift from one semester to the other is marked by the passage of the sun at the equinoxes in March and September. At this point the noontime sun shines partially just below the dome, passing through the grill over the entrance doorway and falling on the floor of the porch outside. More significantly, however, the centre of this equinoctial, midday circle of sunlight lies on the interior architectural moulding, which marks the base of the dome.
On April 21st, the midday sun shines directly on to visitors to the Pantheon when they are standing in the open doorway, dramatically highlighting them. This day is of particular significance, not just because this was when the sun entered Taurus, but more because it is the traditional Birthday of Rome, a festival preserved from antiquity right through to the present day. And it may be that when the building was officially commissioned in AD 128, the person expected to be standing in the open doorway was the emperor Hadrian himself.
The illustration indicates a section through the Pantheon, showing the fall of the noon sunlight at the winter solstice, when the sun is at altitude 24 degrees; noon sunlight, at both equinoxes at altitude 48 degrees; noon sunlight on April 21st, when the sun is at altitude 60 degrees; and finally, noon sunlight at the summer solstice, when the sun is at altitude 72 degrees.
Meaning of Pantheon
The Pantheon is a building in Rome, Italy commissioned by Marcus Agrippa during the reign of Augustus as a temple to all of the gods of ancient Rome, and rebuilt by the emperor Hadrian about 126 AD.
Pantheon is an ancient Greek composite word meaning All Gods. Cassius Dio, a Roman senator who wrote in Greek, speculated that the name comes either from the statues of so many gods placed around this building, or from the resemblance of the dome to the heavens.
“Agrippa finished the construction of the building called the Pantheon. It has this name, perhaps because it received among the images which decorated it the statues of many gods, including Mars and Venus; but my own opinion of the name is that, because of its vaulted roof, it resembles the heavens.”
-Cassius Dio History of Rome 53.27.2
Augustus
Augustus was the founder of the Roman Empire and its first Emperor, ruling from 27 BC until his death in 14 AD.
The reign of Augustus initiated an era of relative peace known as the Pax Romana (The Roman Peace). Despite continuous wars or imperial expansion on the Empire’s frontiers and one year-long civil war over the imperial succession, the Roman world was largely free from large-scale conflict for more than two centuries. Augustus dramatically enlarged the Empire, annexing Egypt, Dalmatia, Pannonia, Noricum, and Raetia, expanded possessions in Africa, expanded into Germania, and completed the conquest of Hispania.
Beyond the frontiers, he secured the Empire with a buffer region of client states, and made peace with the Parthian Empire through diplomacy. He reformed the Roman system of taxation, developed networks of roads with an official courier system, established a standing army, established the Praetorian Guard, created official police and fire-fighting services for Rome, and rebuilt much of the city during his reign.
Augustus died in 14 AD at the age of 75. He may have died from natural causes, although there were unconfirmed rumors that his wife Livia poisoned him. He was succeeded as Emperor by his adopted son (also stepson and former son-in-law), Tiberius.
Argrippa
Marcus Vipsanius Agrippa (c. 23 October or November 64/63 BC – 12 BC) was a Roman statesman and general. He was a close friend, son-in-law, lieutenant and defense minister to Octavian, the future Emperor Caesar Augustus and father-in-law of the Emperor Tiberius, maternal grandfather of the Emperor Caligula, and maternal great-grandfather of the Emperor Nero. He was responsible for most of Octavian’s military victories, most notably winning the naval Battle of Actium against the forces of Mark Antony and Cleopatra VII of Egypt.
In commemoration of the Battle of Actium, Agrippa built and dedicated the building that served as the Roman Pantheon before its destruction in 80 AD. Emperor Hadrian used Agrippa’s design to build his own Pantheon, which survives in Rome. The inscription of the later building, which was built around 125, preserves the text of the inscription from Agrippa’s building during his third consulship. The years following his third consulship, Agrippa spent in Gaul, reforming the provincial administration and taxation system, along with building an effective road system and aqueducts.
Arch of Piety
The Arch of Piety is believed to have stood in the piazza to the immediate north of the Pantheon. Statements made in mediaeval documents imply, but do not specifically say, that the scene of Trajan and the widow was represented in a bas-relief on the Arch – narrating the story of the emperor and a widow, suppressing the emperor’s name. His probable source, the mediaeval guidebook of Rome known as Mirabilia Romae, does not even state that the arch was built in commemoration of the event. It mentions the arch and then says that the Incident happened there.
Giacomo Boni discusses the legend of Trajan, giving many interesting pictures which show how the story was used in medieval painting and sculpture. He has found a bas-relief on the Arch of Constantino, which he thinks may have given rise to the story. It shows a woman sitting, her right hand raised in supplication to a Roman figure, who is surrounded by other men, some in military dress, and two accompanied by horses. Boni suggests that the Middle Ages may have supposed this figure to be Trajan because of his reputation for justice.
Saepta Julia
The Saepta Julia was a building in Ancient Rome where citizens gathered to cast votes. The building was conceived by Julius Caesar and dedicated by Marcus Vipsanius Agrippa in 26 BC. The building was originally built as a place for the comitia tributa to gather to cast votes. It replaced an older structure, called the Ovile, which served the same function. The building did not always retain its original function. It was used for gladiatorial fights by Augustus and later as a market place.
The conception of the Saepta Julia began during the reign of Julius Caesar (died 44 BC). Located in the Campus Martius, the Saepta Julia was built of marble and surrounded a huge rectangular space next to the Pantheon. The building was planned by Julius Caesar who wanted it to be built of marble and have a mile long portico according to a letter written by Cicero to his friend Atticus about the building project. The quadriporticus (four-sided portico, like the one used for the enclosure of the Saepta Julia) was an architectural feature made popular by Caesar.
After Caesar’s assassination in 44 BC, and in the backlash of public support for the former ruler, men continued to work on projects that Caesar had set into motion. Marcus Aemilius Lepidus, who used to support Caesar and subsequently aligned with his successor Octavian, took on the continuation of the Saepta Julia building project. The building was finally completed and dedicated by Marcus Vipsanius Agrippa in 26 BC. Agrippa also decorated the building with marble tablets and Greek paintings.
The Saepta Julia can be seen on the Forma Urbis Romae, a map of the city of Rome as it existed in the early 3rd century AD. Part of the original wall of the Saepta Julia can still be seen right next to the Pantheon.
– edited from Robert Hannah, “The Pantheon as Timekeeper”, 2009.
________
Simulation by the Institute for Digital Intermedia Arts at Ball State University
Project Director: John Fillwalk, Senior Directory IDIA Lab, BSU.
IDIA Staff: Neil Zehr, Trevor Danehy, David Rodriguez, Ina Marie Henning, Adam Kobitz
PROJECT ADVISORS:
Dr. Robert Hannah, University of Waikato, New Zealand
Dr. Bernard Frischer, Virtual World Heritage Laboratory, Indiana University, USA
The Virtual Middletown Living Museum project in Blue Mars is a simulation of the Ball Glass factory from early 20th century Muncie, Indiana. Life and conditions in the factory were one of the key elements of the Middletown Studies by Robert S. and Helen Merrell Lynd in their landmark studies Middletown (1929) and Middletown in Transition (1937). These in-depth accounts of life in Muncie, Indiana, became classic sociological studies and established the community as a barometer of social trends in the United States. In the years since, scholars in a variety of fields have returned to Muncie to follow up on the Lynds’ work, making this small city among the most studied communities in the nation. The center continues this tradition by sponsoring and promoting research on Muncie as Middletown, on small cities generally, and on the themes and issues the Lynds explored.
3D architectural model of a building complex is placed over blueprints, showing layout and structure from an angled top-down view.
A third-person view of a character standing in an industrial building beside a conveyor belt, with various on-screen game HUD elements and technical stats displayed.
A computer screen displays a simulation of a ball glass factory, showing an old photo of workers in a packing room, overlaid with informational text and navigation buttons.
A digital interface displays a map titled Ball Glass Factory Information, showing labeled areas such as bottlehouse and packing room, overlaid on an industrial building background.
A digital interface displays a blueprint map of a ball glass factory, highlighting the bottlemouse area. The map is overlaid within a virtual industrial environment.
A 3D simulation interface showing a virtual lathe machine in operation, with on-screen performance metrics and tool icons at the bottom of the display.
This simulation of industrial life, built as a prototype for a much larger project dealing with all aspects of the Lynd Study, has aimed to create an virtual living museum experience expanding the opportunities for both learning and interpretation. The approach to interactive design embeds learning and navigation experiences subtly into the project to maintain the sense of immersion. IDIA has prototyped several techniques to do this including: interactive objects that allow for close up inspection; objects that when clicked bring up web resources that show information; plans or photographs used in the interpretation; non-player character factory workers, a live interactive avatar of Frank C. Ball who greets visitors and introduces them to the factory; video and audio files of factory experts and archival films; an in-world interactive Heads-Up-Display (HUD) that provides deeper investigation and navigation through the factory; and a supporting webpage with complete documentation on all resources used in this interpretation.
Slelect “Download Client” and follow instructions to install the BlueMars client on your PC (Windows desktop or laptop)
Once you have successfully installed the BlueMars client, select “Go To City” to install the Virtual Middletown virtual world
Register your account and confirm when you receive an email from BlueMars
Modify your avatar (optional)
Explore Virtual Middletown!
NOTE: If you are a Macintosh user (OS X) you may run the BlueMars client and Virtual Middletown virtual world using the Boot Camp emulation: http://www.apple.com/support/bootcamp/
Here are links for additional information on the project:
Recommended settings: Very High Graphics with good graphics cards – otherwise High or Low as needed. Screen resolution: Minimum 1280 by 720 or higher. Sound levels should be up. Many objects in the world are interactive – anything that highlights blue can be clicked with the left mouse button and examined – or might can reference a web page. The heads up display in the lower right hand corner provides information and navigation to augment your visit.
Project partners: The Center for Middletown Studies, Library Services and the Emerging Media Initiative at Ball State University
John Fillwalk and Jesse Allison’s virtual artwork was prominently incorporated into the Carnegie Council for Ethics in International Affairs’ publication Understanding Islam through Virtual Worlds. After a year of research spanning four continents and interviews with dozens of people across the virtual world of the Internet, Carnegie Fellows Rita J. King and Joshua S. Fouts have released their findings from the project at a press conference on January 29th at 6PM.
The report will include a trilogy of deliverables, including formal public diplomacy policy recommendations for the Obama Administration; a broadcast-quality short machinima documentary; and a graphic book chronicling the people, places and findings of the project.
On Friday, January 30 we will hold a discussion in the virtual world of Second Life and via Twitter to discuss and release the findings. More information about that will be posted later. For those who cannot attend the live event, all of our reports will be downloadable via the web.
IDIA Lab’s Kitty Hawk is a simulation of the moment recorded in the famous photograph of the flight of the Wright Flyer (often retrospectively referred to as Flyer I or 1903 Flyer). This flyer was the first successful powered aircraft, designed and built by the Wright brothers. They flew it four times on December 17, 1903, near Kill Devil Hills, about four miles south of Kitty Hawk, North Carolina, U.S. Today, the airplane is exhibited in the National Air and Space Museum in Washington D.C.
IDIA Lab’s Virtual Izapa, is a simulation of the site that is considered to be the birthplace of the Mayan Long Count, which ended its cycle today on December 21st, 2012 – the winter solstice. Viewed today, the site is oriented on an axis where it is aligned generally but not precisely to sunrise on the winter solstice and to sunset on summer solstice. In direct observation today, the alignment along the axis of the ball court from the throne number 2 to the stela number 60 is off-axis by approximately two degrees.